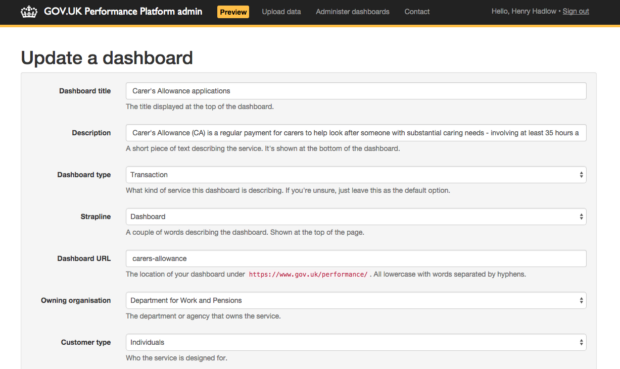
We’ve just built an Admin App that will let us quickly build and deploy Performance Dashboards without any developer input. The launch marks an important milestone for us at the Performance Platform.
Since we set out 2 years ago, we’ve spent a significant amount of time building and configuring the look of the platform. We’ve manually chosen graphs and data for each of the platform's 123 dashboards, and written the underlying code and accompanying content. Although we’ve recently begun to reuse graphs and components when launching new dashboards, we’ve still always needed our developers to write the code.
The Admin App, codenamed the Onboarding App, changes this. On average a new dashboard took us weeks to develop. The app means we can create one in minutes.
Some of our team with no developer skills who work closely with departments will be able to create a dashboard straight away without having to write stories for developers. Meanwhile developers can focus on the development of the platform rather than constantly bringing new services and departments on board.
We’ve already experienced notable benefits since we began testing the app two weeks ago.
For example, I recently added a user satisfaction module to 5 of our Foreign and Commonwealth Office service dashboards. Without the new Admin App, I would’ve had to write stories for our development team and then wait for a developer to become available to do the work. Instead I sent a message to my colleague at the Foreign and Commonwealth Office (FCO) asking if they wanted the module. Within 20 minutes of them saying yes, the module was available on all their dashboards.

Additionally, one of our designers has been able to tweak dashboard displays in production without needing to ask developers to make changes.
Ultimately, the Admin App will increase the rate at which we can help departments and agencies join the platform, while freeing up our developers from repetitive configuration work. Their attention is now fully turned to the development of the platform and making improvements.
If work like this sounds good for you, take a look at Working for GDS – we’re usually in search of talented people to come and join the team.
You can follow Matt on twitter, sign up now for email updates from this blog or subscribe to the feed.

4 comments
Comment by Andrew Robertson posted on
Graphs available to 'Whitehall' GOV.UK publishers are basic. The alternative is to insert an image of a graph created in different software, which won't be accessible and is just one size. Could the hard work done here be shared with Whitehall publisher tool in future, so better graphs can be included on GOV.UK pages I wonder?
Comment by Matt Harrington posted on
Hi Andrew,
It's something we would like to look at in the future. At the moment we cannot embed our graphs but we are doing some work now which will make this possible. I'm keen to know, how would you see these graphs being used? As static snapshots or something that has a feed of data and would update over time?
Comment by Andrew Robertson posted on
Hi Matt.
I was thinking of static graphs for things like annual reports and accounts or R&D reports, where there might be more data to display that currently doesn't work in the web graph tools available. Of course, we'd need to consider user need and not just create a complicated graph because we can. More graph flexibility may encourage a further shift away from PDF to HTML publications.
Having the ability to update the data periodically could be useful, but I'm struggling to think of many examples; perhaps updates on performance data against organisation plans and strategies?
Comment by Matt Harrington posted on
Hi Andrew,
It is useful to understand how you think the graphs could be used. I think one of the best features of our graphs is that we can update when new data becomes available. However, if we can make it easy enough for graphs to be created for static datasets then it might be nice to have consistency and get away from publications. As you say, we need to make sure that there is a need for this first.