I recently attended my first DAUGS meet-up at the National Audit Office. DAUGS is a community of practice showcasing innovative work by data and performance analysts across government.
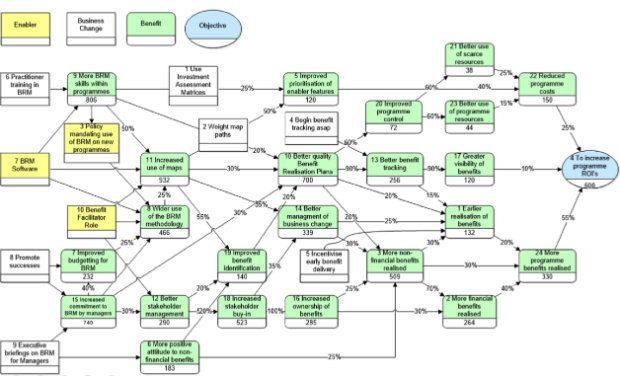
Performance Analysis & Benefits Realisation
Philip Sturtivant from the Skills Funding Agency gave a fascinating presentation outlining a logical structure to define a programme's objectives and benefits, and talked about the challenges of building a coherent framework out of a series of related Agile projects.
He talked about how to uncover your real business goals with four great questions:
- Why? What are you trying to achieve?
- Who? Which people / groups will make the change?
- How? How will this change their behaviour?
And only when you’ve thought about these ask:
- What? What are we actually going to deliver?
When funnels aren’t enough
Anne Carr,Senior Performance Analyst on GOV.UK Verify, demonstrated how relying on funnel plots can lead to an oversimplified view of customer journeys.
Anne’s team used individual level data to follow customers through the Verify service, concentrating on customers with “less happy journeys”. They used data to devise additional prompts for suggesting the most appropriate identity providers, increasing the user success rate.
Data visualisation to tell a story
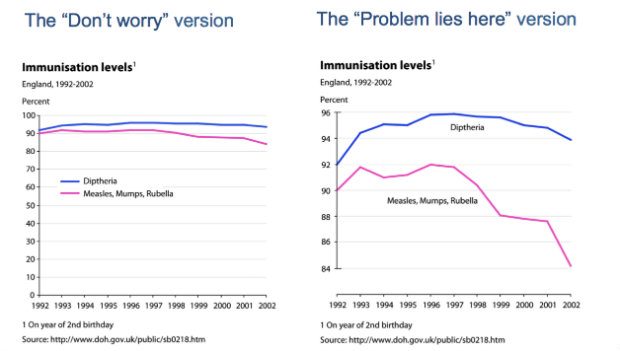
Catherine Hope, DWP’s Presentation Champion showed us how she has developed a new publication style for DWP’s statistics. Moving away from dry, text heavy, documents to eye-catching and informative presentations.
She showed how small, simple changes can make a big difference, for example, removing excess lines from tables, aligning numbers and adding commas to make long numbers more scannable.
She ended with a simple message: “Just do it … but there are plenty of sources of expert help”.
Building dashboards
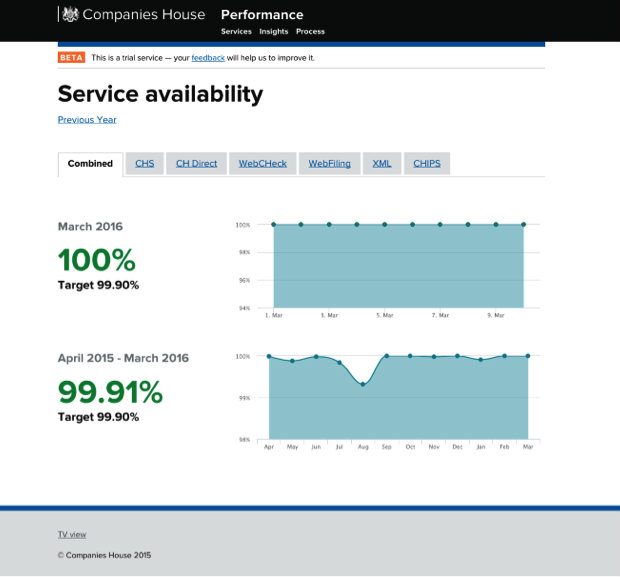
Helen Hourihane from Companies House demonstrated her internal Companies House dashboards. Using the Piwik API, other data sources with jQuery and HighCharts she produce some really impressive visualisations.
Michael Suter-Tibble & Ed Guccione from DWP took us under the bonnet of their dashboards and showed how they combined the Google Analytics API, Google Sheets, JSON and charts to quickly build dashboards that are shareable within the constraints of DWP IT infrastructure.
DAUGS is a great place to see innovative work and discuss best practice, careers, training and more, so do come along to the next one on 21 July.
Ben is a Data Scientist in the GDS Better Use of Data team.