
One of the reasons government departments collect information about people’s ethnicity is to ensure that services are provided fairly, and to monitor outcomes (such as unemployment, custody rates, or qualifications).
Much of this information is published by the departments themselves but also on the Ethnicity facts and figures pages of GOV.UK.
Inputs and outputs
‘Harmonisation’ is about improving the coherence and comparability of statistics, as explained in a recent blog post by the Government Statistical Service (GSS). Harmonisation is key in maximising the value of data collected and the resulting statistics – it ensures commonality in the use of definitions, survey questions, administrative data, and the presentation of outputs.
One aspect refers to the classifications used in data collection – ‘inputs’ – and in the presentation of data – ‘outputs’.
The main benefit of harmonisation in terms of ethnicity data is that it allows results from different sets of data to be compared for the same ethnic group. The GSS has established a set of harmonised principles relating to ethnicity.
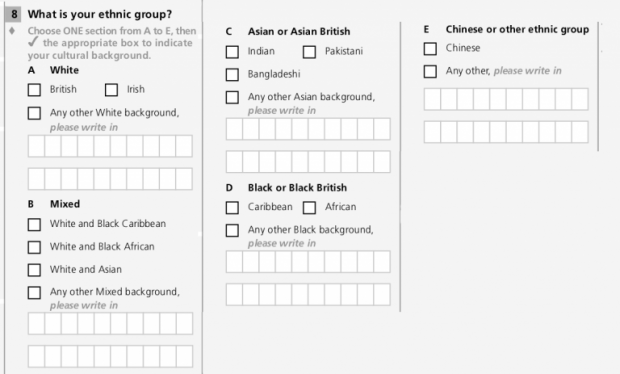
Most of the health data presented on Ethnicity facts and figures was collected using the 2001 Census ethnicity classification, which has 16 categories, plus ‘unknown’.
And, in turn, most of the health data on the website also shows the same 16 categories – in other words, the input and the output classifications are aligned. Some data is presented using a summary version of the 16 categories, which shows 5 broad ethnic groups (Asian, Black, Mixed, White and Other).
3 rules underpinning ethnicity data harmonisation
There are 3 important rules underpinning work on harmonising ethnicity data:
Rule 1: Balance comparability and context
Present your data in ways that maximise comparability with other data sets, but which are most appropriate given the nature of the phenomenon in question.
For some datasets, it's quite reasonable to comment on the combined Asian group. In other datasets it makes little sense because the data for the different Asian ethnic groups is quite different. For example, the employment rate in 2017 for the Indian group was 74%, and for the Pakistani and Bangladeshi group it was 55%.
Rule 2: Balance your needs with users’ needs
Collect as much detail/granularity (about people’s ethnicity) as is required for any analysis you want to do now and in the future.
But also make it as easy as possible for people to identify themselves as they wish.
Rule 3: Make data available in as much detail as possible
You should make data available in as much detail as possible. But this is subject to the protection of individuals’ confidentiality, and the need to ensure that estimates (small) groups are robust.
One approach adopted for some data on Ethnicity facts and figures is to aggregate data for several years, in order to produce a sample that is sufficiently large to enable detailed analysis.
While this involves consideration of the trade-off between the granularity of ethnic classifications and the timeliness of the data, many users will tend to favour the former, especially as many ethnic disparities are relatively sustained and so unlikely to change year-by-year.
Case study: Childhood obesity report
Public Health England (PHE) recently published a report on differences in child obesity by ethnic group.
In this research, drawing on data collected using the 16 categories, the analysis and presentation of the results used 4 categories (Asian, Black, White, and Other) and had no results for the Mixed group.
We asked analysts at PHE why they had adopted this approach. They explained that rates of obesity prevalence of the 3 Mixed ethnicity groups are more similar to the minority ethnicity than to each other.
Because of this, they combined:
- children who were Mixed White and Black African, and Mixed White and Black Caribbean, with children who were Black
- children who were Mixed White and Asian with children who were Asian
One other issue relates to ethics. In this instance, data which is likely to have initially been self-reported by a parent was analysed in ways that the parent might not have anticipated. Does this matter? My own view is that the treatment of children of mixed ethnicity in this analysis was ethically acceptable, because:
- this was a piece of complex secondary data analysis, going well beyond the simple presentation of aggregate survey responses – had the analysis been a simple presentation of child obesity by ethnic group, it would not seem ethically acceptable to have included children of mixed ethnicity in another category
- this analysis was intended to inform the work of health professionals and to support health interventions – my view is that these purposes are consistent with wider notions of the ‘public good’
Usability of data is paramount
All of this is a good illustration of my view that 'total standardisation' – the complete alignment of output categories with input categories – should not be pursued at the expense of the utility of the data.
In this example, the ethnicity data comes from administrative data held by the school the child attends or is taken from their health record. Therefore, ethnicity is not collected specifically for the purpose of reporting on childhood obesity.
In general, the detailed categories are presented, for data collection, at least in part to help respondents identify as they wish, with minimal respondent burden. Excluding the Mixed category from a data collection is likely to impact on a respondent’s ability to self-identify, and including each category of Mixed with the relevant minority group might lead to poor-quality data collection.
This blog post has emphasised the importance of harmonised data collection about people’s ethnicity, and of giving real thought to the way that data is analysed and presented. The Race Disparity Unit will continue to work with the Office for National Statistics and other stakeholders to establish an updated approach to harmonised ethnicity data collection that reflects the 2021 Census round.
We're interested in your views on the 3 rules. We’d also like to hear some examples of innovative ways in which the ethnic groups used in collecting data have been combined for analytical purposes. Please leave a comment below.

1 comment
Comment by Jim Nixon posted on
Great blog.
I previously worked on the RDA data in DWP.
Clarity is the key.
For example, breaking down employment rates by ethnicity and local authority (LA) we'd tend to use the 3-year Annual Population Survey (APS), but the total of those would not match the published total of GB because that would come from the quarterly Labour Force Survey.
Similarly, we could use the 1-year APS for the larger LAs (e.g. Birmingham) when looking at them in isolation, but that wouldn't be comparable with the full LA list. Explaining all of this is important.
Another thing to consider with timeliness of the data in Rule 3, is that as long as you're consistent with the approach, the trend the data shows - is it improving? is it getting worse? - tend to be more important.