“In God we trust, all others must bring data” - W. Edwards Deming
A guest blog from Martin Richardson, Service Manager, DVSA.
Every 20 months or so, a further one million people use the public facing Book a practical driving test service – 97% of them now choose to do so online. This generates lots of data!
It’s actually two services in one – the initial bookings (1.5 million p.a.) and then ‘changes’ to those bookings (0.8 million p.a.). We define ‘change transactions’ as moving the date of the appointment or cancelling/refunding. But the ‘change’ service is also widely used for other purposes e.g. to look for cancellations or just to check details of the test. So there isn’t the clear linear user journey that is characteristic of bookings.
For the past 9 months, we’ve been continually iterating these live services – delivering well over 100 enhancements so far, plumbing in more data extractions as we go. As a Service Manager, I rely on this data to help manage the improvement process.
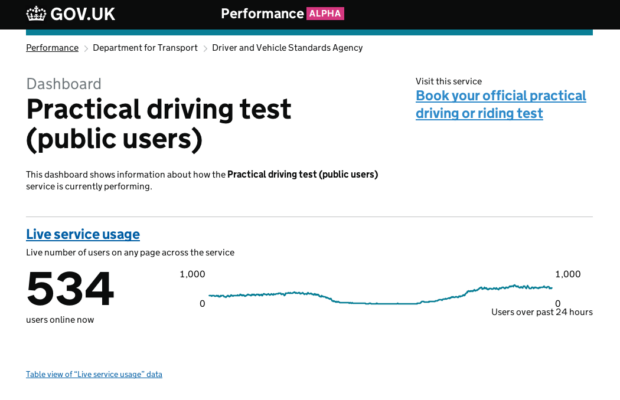
So I’m delighted that a set of dashboards for these services have been launched on the Performance Platform, bringing together much of the data I need into one easily accessible place. Updates to the data are largely automatic and come from a variety of sources – including our web analytics package, GOV.UK ‘done’ pages and a periodic upload of management information data. We’ve set up 3 connected dashboards – one for ‘booking’, one for ‘changes’ and one presenting data that applies to our service as a whole.
I find the Platform very useful for identifying trends – particularly in digital take-up, user satisfaction and device type usage. For example, the proportion of users accessing the site via mobile and tablet devices is increasing relentlessly – now at over 46% for unique users - but over 52% in terms of visits. This implies mobile users access the site more frequently (which intuitively makes sense). The ‘change’ service attracts a higher proportion of mobile visits than ‘booking’ (we think this is consistent with users repeatedly looking for cancelled tests whenever they have a spare moment).
The Platform is continuing to evolve and I liaise with GDS as one of a panel of Service Managers suggesting and reviewing new features. For example I’ve suggested introducing graphical representations showing how the progression rates for each stage of the transaction change over time. It would also be great to be able to segment user satisfaction scores by browser type, platform and device (which I currently do manually). When user selectable date ranges are introduced to the Platform, I’ll look forward to being able to more easily align the data with specific iterations of the service.
Here are links to the new book, change and overall practical test dashboards.
2 comments
Comment by Anthony posted on
Hi hoping you could provide some advice on publishing data please- I am looking to publish the data results from a stakeholder newsletter survey. Do I have to adhere to the 'code of practice for official statistics?' Thank you.
Comment by Matt Harrington posted on
Hi Anthony,
That is not something I've been asked before. I wouldn't have thought so, but to avoid any doubt it might be best to contact the Office for National Statistics.
Thank you
Matt