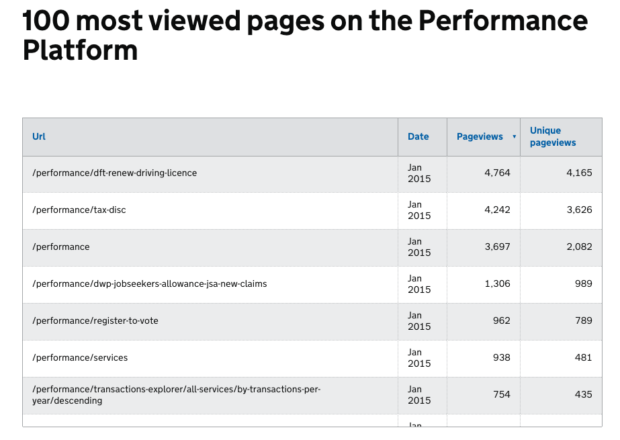
We recently added a new module to our own Performance Platform activity dashboard. It’s a table showing the 100 most visited pages on the Performance Platform for the last month.
Many people have asked us which dashboards are being looked at most. Rather than share this data by email or compile a report, we’d rather put it live so you can see for yourself.
We think it’ll be particularly useful for dashboard owners - they’ll be able to see at a glance how many times their data is being viewed. It’ll give them an indication of how well this information is being communicated across their organisation and stakeholders.
Right now the table shows pagepath, pageviews and unique pageviews, but there’s plenty of other info we could show. We’re keen to hear your ideas so we can iterate on this work.
One quick and useful change is making the urls in the table clickable - we’ll be adding that soon. If there’s anything else you’d like to see please leave us a comment.

