Five more graduates from our Data Science Accelerator Programme have been working on some really exciting projects. With the guidance of their mentors, the latest intake to finish the programme have used a range of data science techniques to create prototypes and develop their data science skills. Here’s an update on their projects:
David Bonfield - Department for Business Innovation and Skills (BIS)
David looked at company accounts published as open data by Companies House, exploring whether access to modern data science tools would enable them to be analysed in bulk to inform policy and operational planning. He tried out several open-source libraries for reading the XBRL data format, and had most success using the “XBRL” package for R. Work remains ongoing but successes to date include:
- Working with the package author to ensure the package worked properly with UK accounts. The package needed a small modification to enable it to extract the “sign” and “scale” attributes sometimes used in UK data - important because these can turn profits into losses, and change tens to tens of thousands! This modification is now incorporated into the CRAN repository for everyone to use.
- The creation of an analytical dataset for policy and operational analysis, allowing analysts in Companies House and BIS to more easily use the data.
Joe Elliston - Department for Business Innovation and Skills (BIS)
By 2018, there will be around £100bn worth of student loans, so predicting how much will be repaid is very important to the government. The current forecasting model uses a statistical programme called SPSS and modelling in Excel. Joe prototyped an open source extension using the Shiny web framework for R. This would enable a diverse range of users (e.g. economists) to interact with the model, and Joe showed how this framework could account for new loan repayment scenarios, such as employment shocks or growing gender pay equality.
David Goody Department for Education (DfE)
David examined many factors which could help the DfE predict which schools are most at risk of getting into financial difficulty. The first phase involved detailed analysis of the underlying data combining traditional techniques as such logistic regression, principal component analysis and correlation analysis with machine learning methods such as decision trees, random forest ensemble models, lasso and ridge regression. This lead to a method of creating risk profiles for schools. The second phase involved developing ways to present these risk profiles which included displaying analysis through embedded Google Maps and using the k nearest neighbour algorithm to display schools with similar risk profiles. We also experimented with dynamic report layout and automatically generated text to customise the reports based on each schools individual risk profile.
Callum Staff - Food Standards Agency (FSA)
Callum looked at better exploring the FSA’s Food Hygiene Rating Scheme (FHRS) dataset. The first part of the project involved using regression and classification techniques to see if, from characteristics such as type of establishment (restaurant, pub, cafe, hotel, etc.) and location, the FHRS score could be predicted in the case of regression analysis or, in the case of the classification techniques, if the establishment could be defined as compliant or non-compliant. The aim of this was to be able to target interventions to save on resource if strong enough predictive models could be constructed. However, because of the variation of FHRS performance across the predictive variables, the models were not strong enough i.e. food hygiene quality varies massively within subgroups of Food Business Operators. This was also proven using clustering techniques such as k-means and hierarchical clustering - no strong clusters with similar FHRS scores could be found.
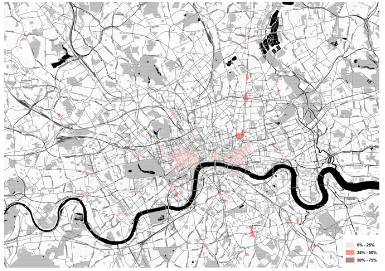
The second part of the project used GIS software and spatial clustering techniques (DBScan, Optics, the Getis-Ord Statistic) to look at clusters with high proportions of non-compliant establishments. This has demonstrable uses for Local Authorities in targeting inspections, and as a result, the creation of LA level maps and a travelling salesman type tool are being explored to reduce resource expenditure when planning which establishments to inspect.
Gavin Thompson - Health & Safety Executive (HSE)
Gavin explored the use of machine learning techniques and natural language processing to attempt to classify various aspects of workplace injury reports. He used historical workplace injury reports (reported to HSE under the RIDDOR regulations) that contained both text fields (i.e. job title) and corresponding coded fields (i.e. Standard Occupation Codes (SOC)) that were manually assigned by operators. This data was suitable for supervised machine learning and he developed Naive Bayes Classification models to predict the occupation codes for the injuries.
In the current reporting process the free text is still collected but, due to resource constraints, the coded SOC information is no longer manually assigned. Once the models were developed Gavin joined these up to a prototype web application built in Python, that could either be used to automatically recode the occupations or produce an intelligent dropdown list that put the most likely occupations at the top. This could potentially help users input injury data and allow HSE to collect coded information with reduced manual intervention.
Now… over to you!
The Accelerator Programme is all about innovation. We’re giving people time and resource to try new ideas to make their areas of government better. If you’re a civil servant and you’re inspired by what colleagues are already doing, please get in touch with us!