Exploring patterns in data is a fundamental part of analysis. One approach is to organise the data into themes or clusters. Cluster analysis is very popular but there is a bewildering variety of methods. The choice depends on the problem at hand - the best algorithm for one particular dataset could perform poorly on another task. In this blog, we look at 3 key decisions to help guide this selection process.
How to choose the right clustering technique?
Decision 1: Knowledge vs Autonomy
The first decision is how much to let our prior knowledge guide the choice of clustering technique: 1) Supervised algorithms are strongly guided by the user; 2) Semi-supervised algorithms balance user guidance and evidence in the data; and 3) Unsupervised algorithms need no additional input from the user.
An unsupervised algorithm, such as Kernel Density Estimation, is the least biased option since the algorithm takes the data as its only input (the user doesn't specify any parameters). However with no help from existing knowledge, more data will be needed to provide the necessary information to infer the clusters.
If the amount of data is limited and the existing knowledge is considered reliable, the user can guide the clustering with supervised methods such as K-mediods,
And, where there is uncertainty over the existing knowledge and the amount of data is also limited, semi-supervised approaches, such as Robust Trimmed clustering, are useful.
Decision 2: Shape of the expected clusters
The second decision to help choose our algorithm is the expected shape of the clusters. This can have a dramatic effect as the visualisation below shows (adapted from a blog by David Robinson).
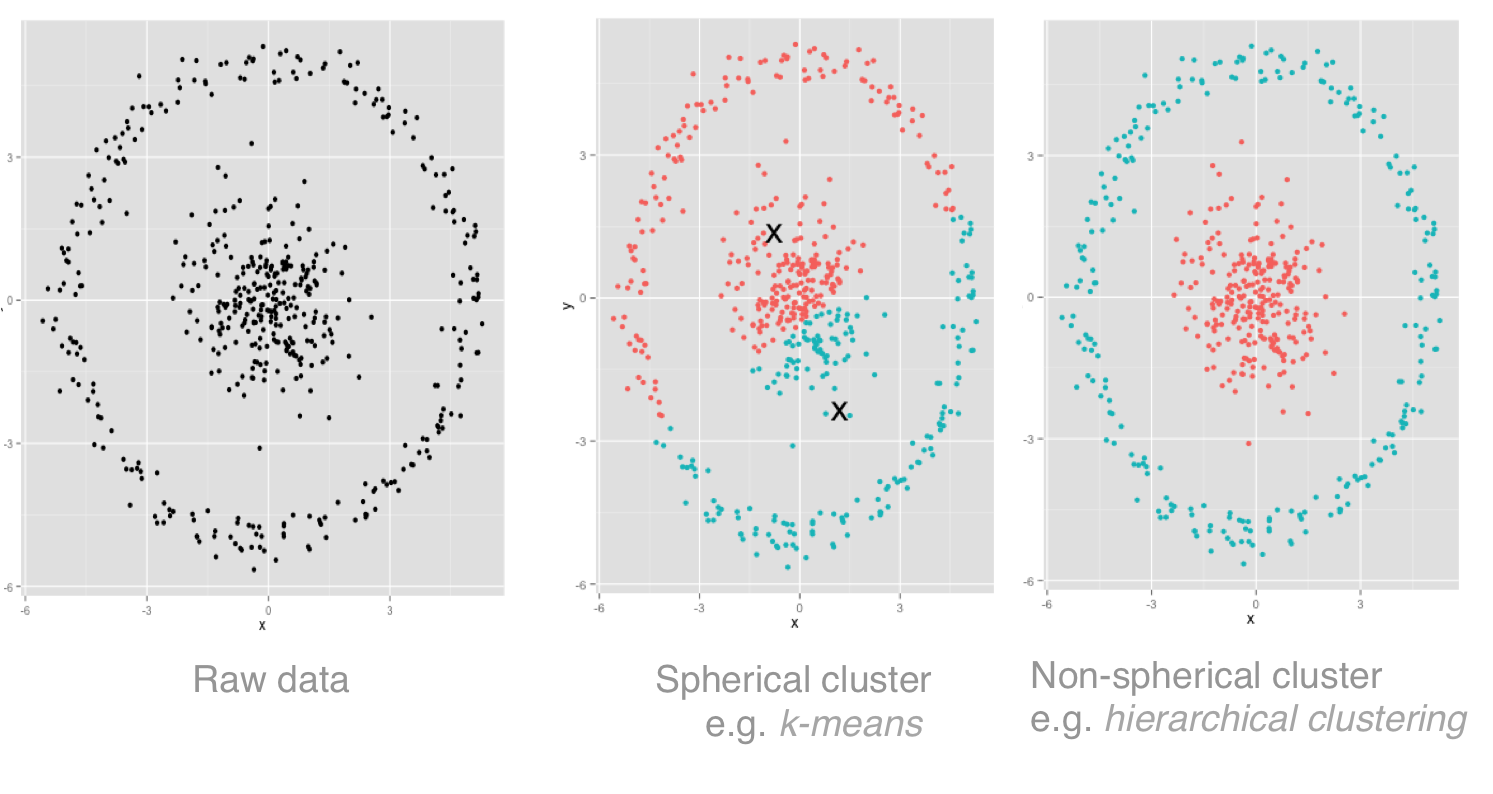
Two natural clusters can be seen (the inner and outer circles). K-means clustering (as in the second image) incorrectly splits the data by closeness to the cluster midpoints (i.e. in multidimensional space it models the clusters as hyperspheres). The third image (hierarchical clustering) doesn't assume this about cluster shape and is better for this data.
Decision 3: levels of noise in the data
The final decision is how much noise we expect in the data. If we know that a significant number of data errors is likely, approaches such as Robust Trimmed clustering can help minimise the impact on the final result. These algorithms work by removing a specified portion of data that is most likely to be noise.
In part II of our blog, we will take a specific example of clustering as an illustration. In the meantime, if you have any questions or feedback please let us know by writing in the comments section below.