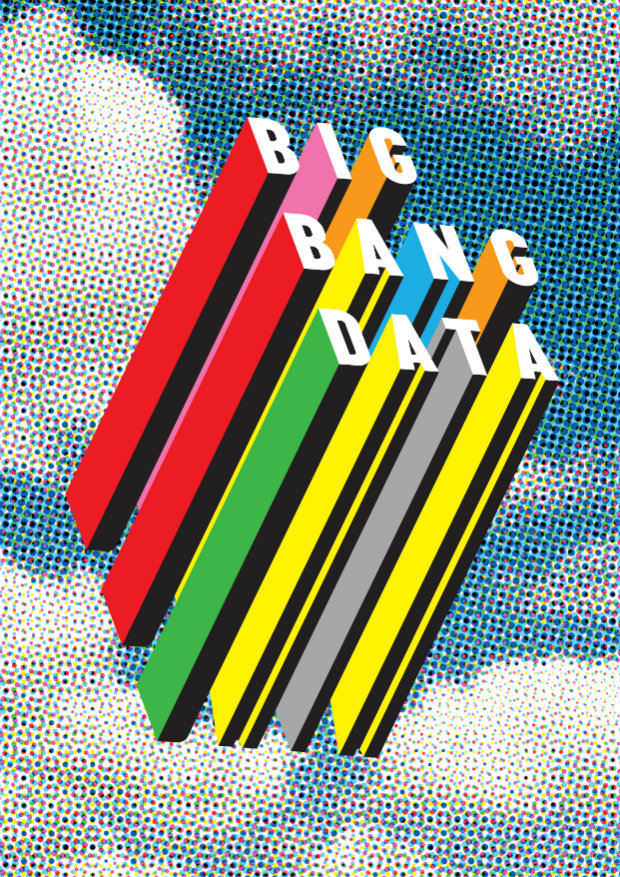
Last week some GDS performance and data analysts made a ‘field trip’ down the road to the Big Bang Data exhibition at Somerset House in the Strand. The exhibition curators aim to highlight “the datafication of our world and how data affects everyone”.
The five themes in the exhibition are:
- data and you
- data and cities
- data and democracy
- data and privacy
- data and design
As an analyst working in government, I was mostly aware of the issues discussed, but I found it thought-provoking to see things represented as both data and art.
Some of the exhibits made a particular impression on me and I have detailed these below.
The internet is physical
We tend to think of the internet and the cloud as rather distant and virtual, brought to us through a screen and router. But, the many physical elements are all around - cables, antennae, cabinets and data centres; all of which are essential to make the internet work. The Networks of London work maps this infrastructure in parts of the city.
Data transmission and visualisation is not new
The submarine cables that transmit 99% of international data have a long heritage. The first message was sent (and received) through the transatlantic telegraph in 1858.
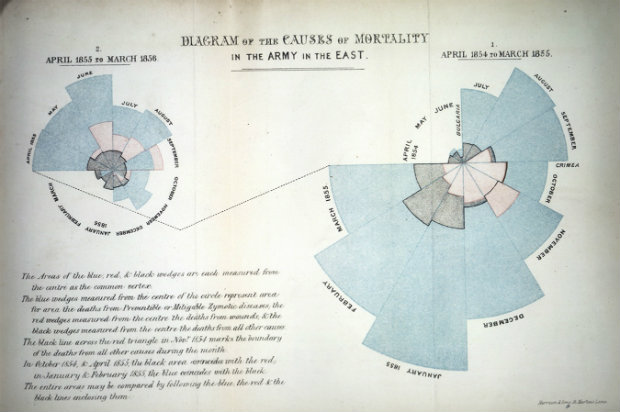
Of course data design and visualisation has a long heritage too. Florence Nightingale was methodical in collecting and interpreting data, presenting striking diagrams including the first pie chart to make her case for cleaner military hospitals. On view was Notes on Matters Affecting the Health, Efficiency and Hospital Administration of British Army 1858 with the chart demonstrating the ratio of British soldiers who died during the Crimean War of sickness, rather than of wounds or other causes.
Protect your data
Of course, as analysts, we must adhere to best practice when collecting and using other people's’ data. We should also look after our own data trail and encourage others to do so.
We see adverts on most of the content we view online, but we don’t have any method to track which ads we’re being served. The Office for Creative Research has developed a browser extension that helps you understand the quantity and kind of ads you see.
Data in action… or not
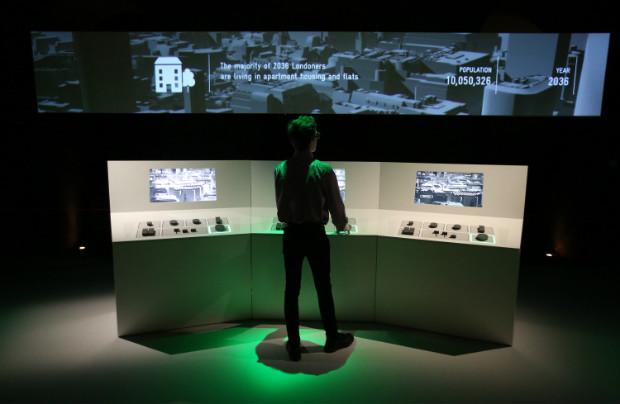
In the exhibition’s “Situation Room”, you have the opportunity to explore the Future Cities Catapult tool. You stand at a control panel and answer questions about a range of London’s social, economic and environmental issues, and the tool then uses s open data to predict how your decisions will affect the city and its future population in 2036.
Finally, I was most moved by the Liquid trace - The Left-to-Die Boat Case video about travelling migrants in 2011. The digital trace of a boat with 72 migrants on board has been recreated - showing how the boat drifted for 14 days between Tunisia and Italy. Distress signals were ignored by a series of NATO surveillance sweeps and nearly everyone on board died.
This was a very sobering reminder that the vast amount of data being collected can be used for good, bad or simply ignored.
Big Bang Data is on at Somerset House, London, until 20 March 2016. More information on the exhibition website.
Peter Jordan is Head of Performance Analysis at GDS