Understanding what users think about GOV.UK helps us to build better services to meet citizens' needs. Recently we've automated some of the process for analysing thousands of responses to one of our user surveys.
In addition to the ubiquitous 'Is there anything wrong with this page' at the bottom of every page on GOV.UK, we ask a subset of users about their journey through GOV.UK. In some cases the answer must be selected from a scale (for example: 'very satisfied', 'neither satisfied nor dissatisfied', 'very dissatisfied'), while others require a free text response, for example: 'Why did you visit GOV.UK today?', 'Did you find what you were looking for?', and 'Where did you go for help?'.
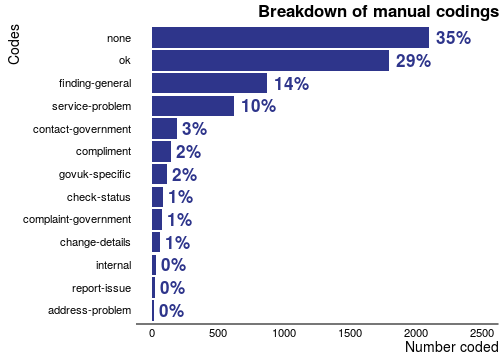
We receive around 3,000 responses to this survey every month, and until now, a group of volunteers from various GOV.UK teams have manually classified the responses into a number of pre-defined classes. These classes help us to define the issue that a user has experienced so that we can better measure the performance of GOV.UK, and pass on specific responses to the relevant teams. To date we have manually classified about 4,000 surveys.

Comments and complaints often revolve around difficulty finding things, or problems with a specific service. Often, we see that responses are simply 'ok': the user describes why they came, and has no specific comment or complaint. Often we also classify comments as 'none' this is where the user has left us some comments, but there is not enough information to allow us to classify it as either 'ok' or one of the other classes.
Machine learning and natural language processing
Typically it takes a volunteer around 45 minutes to classify 100 surveys, so if we want to manually classify all 3,000 surveys we receive each month, this is a significant investment of time!
Our challenge was to try to automate some of the process to reduce the burden on our volunteers by using machine learning techniques. Broadly, machine learning is a field focussed on the use of algorithms that can learn patterns from data, and use these patterns to make predictions from new data.
Before applying a machine learner to the data, we first need to develop a numeric representation of each response; this is where Natural Language Processing (NLP) techniques come in. In simple terms, for each survey we receive from GOV.UK, we need to find a way to translate it into a vector of numbers. One simple way to do this is by creating a document-term matrix (DTM) which maps all the terms present in all documents (surveys) into one large (and often sparse) matrix. This can then be used as the starting point for machine learning. We've talked a bit about this in a previous blog post on analysing user feedback.
One of the issues we quickly ran into with this approach, was that there is huge variation in the amount of information that users choose to give as free text: often it is just three or four words. This makes it difficult to automatically classify the surveys because there are myriad ways of describing the same issue, and several words may have the same meaning (synonymy), or one word may have several meanings (homonymy). Some of these problems can be overcome by the use of methods such as Latent Semantic Indexing, or Latent Dirichlet Allocation, which allow us to combine words with common meanings together.
For these approaches to work well however, we need a lot of pre-classified examples. If we work on the assumption that we need a few thousand manually classified examples for each class, it could take us several years before we have sufficient data at the current rate our volunteers are able to classify them.
Focussing down
To solve these problems we needed to focus down on a smaller problem. Instead of attempting to automatically classify all surveys into all classes like a human classifier would, we focussed instead on the largest class: the 'ok' class. This is a good class to focus on because we don't need to take further action when a user tells us they are satisfied with their journey.
One of the issues with the 'ok' class is that this class has a lot of variation in the amount of text that users leave, although often it is very little. Some examples are given in the table below:
| Describe why you came to GOV.UK today | Have you found what you were looking for? | Overall, how did you feel about your visit to GOV.UK today? | Where did you go for help? |
| look for jobs | Not sure / Not yet | Very satisfied | work sites (Indeed, total jobs) |
| To submit an AP1 for registration | Yes | Satisfied | NA |
| Check Vietnam visa requirements | Yes | Very satisfied | NA |
| checking travel advice | Yes | Very satisfied | NA |
| Lost passport | Yes | Satisfied | NA |
So, rather than use the words themselves as features to train our algorithm, we developed three very simple features which help us define the 'ok' class. A feature is simply either present in the original data, or 'engineered' by us from a combination of variables. These features are: the ratio of upper case characters to total characters, the total number of characters entered in the text box, and the ratio of exclamation marks to the total number of characters.
We also combined a number of other features that were present in the data collected in the survey, for example: the page the user was on when the survey was triggered, the date it was triggered, and the time taken to complete the survey. These simple features have proven surprisingly effective in classifying the 'ok' class.
Subjectivity of manual classifiers
One issue we thought about was how accurate our volunteer classifiers are. If we can't be sure that two people would classify the survey in the same way, how can we expect an algorithm to get it right?
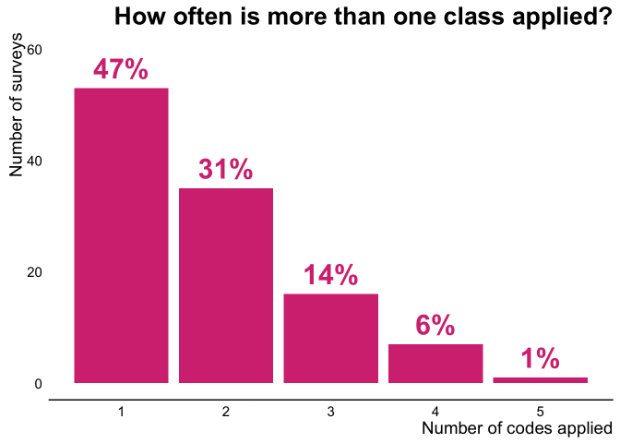
To shed some light on this we organised a workshop with our manual coders, and this time we asked 11 of them to manually code the same series of surveys. The result was quite surprising: 53% of the time, manual coders disagreed about how a survey should be coded. We can see this in the chart below, which shows how often volunteer coders applied more than one code to an individual survey.

In one case we found that one survey was categorised 5 different ways by the 11 people that coded it. The free text from this particular survey is shown below (modified slightly for publication):
| Describe why you came to GOV.UK today | Where did you go for help? | If you wish to comment further, please do so here. |
| Check why my payment had not yet been paid for 2015/16 | This web-site, which provided me with contact details.
The original message from the Dept was not correct |
My question was dealt with effectively and quickly, which was much appreciated. |
Fortunately there was a way out. By implementing a system of majority voting, we found that (with the exception of when there were just two coders) we could almost always find a majority.
This allowed us to change the way that we manually classified our surveys, ensuring that we always have at least two people coding each survey. If after two people have classified a survey, we still have disagreement, we can refer the survey to a third person. In this way, we ensure that the training examples that we use to train our algorithm are sufficiently objective.
Bringing it all together
After generating newer, simple features and curating a more objective dataset, our machine learning algorithm was able to identify 'ok' responses 88% of the time. This saves a huge amount of time for our volunteer classifiers, although there is still room for improvement. We still get the odd 'ok' survey slipping through the net which is then correctly classified by our manual coders. By collecting these, and feeding them back into the training of the algorithm, we can improve its performance month on month. Since our manual coders are now freed to focus on the difficult classes, we can also start to develop algorithms to automatically classify these as we more quickly accrue manually coded examples.
Ultimately we probably won’t get to a point where this process is entirely automated, and nor would we want to. Although the manual coding process is time-consuming, our volunteer coders come from across a range of GOV.UK teams, which helps ensure that feedback from our users is returned directly to the teams who are best placed to do something about it.
We have published the code used to prepare the data. If you want to learn more about data science techniques we’re using at GDS, you can subscribe to the GDS data blog.
Matt Upson is a Data Scientist at GDS.
2 comments
Comment by Nick jhones posted on
Machine learning helps you to work on big data. It can detect objects according to the given data, this technology is best for prediction. <a href="https://googlesupport.co/google-chrome-technical-support/">google chrome support</a> help you to get all the advantages of ML.
Comment by Rushdi Shams posted on
How did you get the training data labeled?