Product analysts on GOV.UK can access a vast amount of user behaviour data through web analytics. We’re always looking for different ways to mine this information to discover new and interesting insights. One area we’ve tried recently is examining real-time data.
Real-time data has become increasingly accessible in the last few years. It can bring some real benefits:
-
Ensuring analytics data is being captured in a test environment before a site is made live
-
Being able to see what is currently popular on your website
-
Measuring the immediate impact of social media
-
Making sure your site has not gone down
I want to share some of the work we’ve been doing with real-time data, and mention a technique we’ve found that might help other teams to make it even more useful for them - without them needing to write any code.
Catching the eye
Real-time data appeals to people’s sense of curiosity. One of the first products we made using real-time data was a basic screen of rolling search terms. We regularly analyse how people are searching the site, but making this constant stream of requests visible on a big screen made colleagues much more aware of search and user needs.
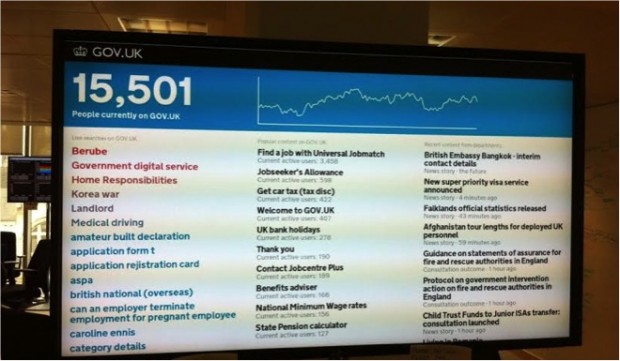
People are mesmerised by the endless list of queries - the ability to see what people are searching for right now, the sheer range of topics, and how words are misspelled. It’s useful when there’s a big breaking news story or topical event, as we can see related search terms cropping up more often among all the usual day-to-day dealings with government.
The immediacy of the data often inspires action. Spotting an unusual search term as we walk past forces us to pause and think ‘what on earth is that?’ or ‘how we can make our site navigation work better for users to reach that topic?’.
Getting the most from real-time data
On GOV.UK we have a Departments and policy section that subdivides into several areas such as news, consultations and policies. An aggregate view of the number of current visitors on this section of the site isn’t that useful to us - it’s too high level. What we wanted was to be able to show current visitors to each of the sub-sections and display this on one dashboard.
To do this, we created a real-time widget by applying a regular expression filter for each of the section pages we wanted to feature on the dashboard. For example, this is the configuration for our Topics section:
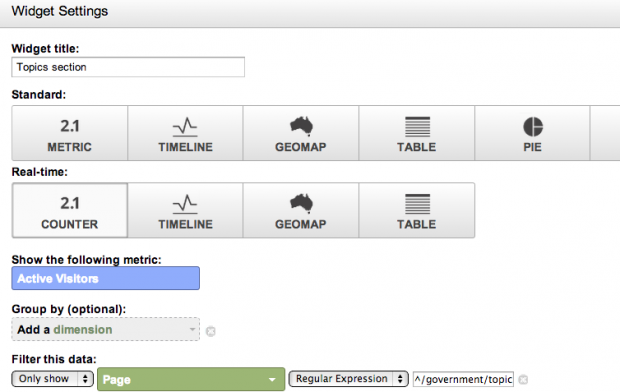
It was then just a case of rearranging the widgets into a dashboard.
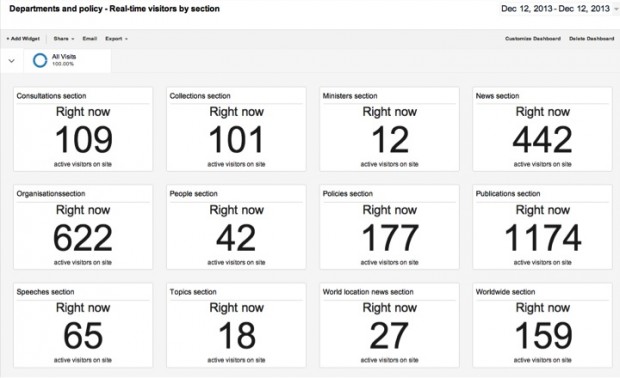
This technique should be possible with any vendor which provides real-time data and dashboard widgets. The dashboard is now displayed on a big TV screen next to our Departments and policy team, allowing them to instantly see the relative popularity of sections and if sections are receiving unusual levels of traffic.
Creating real-time dashboards for services
This technique works particularly well when applied to a transaction site as the active visitors can be broken down to show how far they have got through the service.
The Carer’s Allowance site allows carers to apply for financial help from government using an improved online service. It’s one of 25 exemplar services GDS is working with to make them simpler, clearer and faster to use.
The service has various sections where users fill in their details to progress:
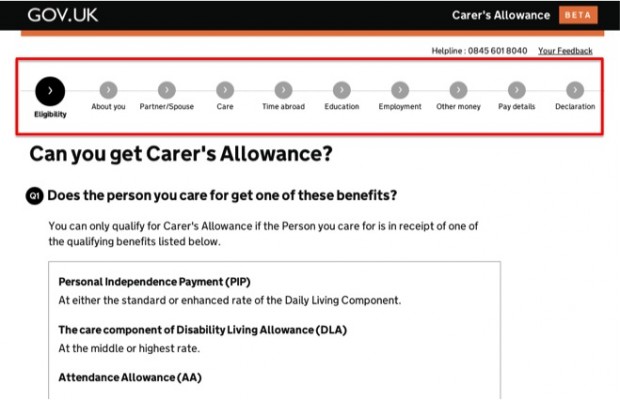
Using the same method as above we’ve created a real-time dashboard which shows the Carer’s Allowance team how many users are currently live on the service and which particular section they are in:
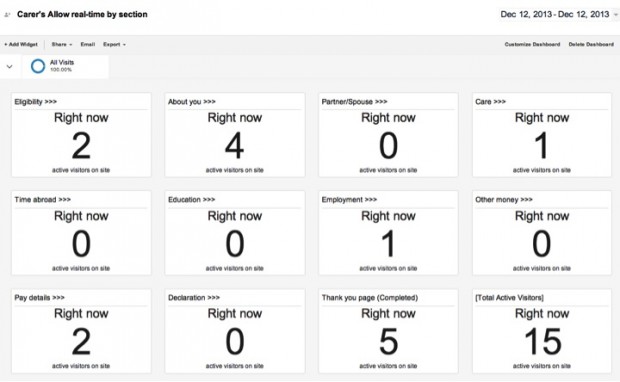
This extra instrumentation is helping the team better understand the user journeys and where people are tending to drop-off so they can continue to improve the service.
We’ll be doing more work with real-time data across GOV.UK products and services and will continue to blog about what we learn. In the meantime, if you have any interesting stories about using real-time data please do share them in the comments.

9 comments
Comment by Gabi posted on
Hi Ashraf,
great and very useful article, thank you! Now I am trying to find any tool, which is able to send me an sms/email alert when real time traffic on my website increases. Actually I am using google analytics alerts, but there is a long delay, I need some "real time" tool. Thank you.
Comment by Ashraf Chohan posted on
Hi Gabi
This blog post may assist: https://dataingovernment.blog.gov.uk/2014/02/12/automating-email-alerts-for-trending-content/
It covers how we've used the Google Analytics 'Magic Script' to to pull usage data in the past hour and to send an email alert when particular thresholds have been reached.
Kind Regards
Ashraf
Comment by Dominic Hurst posted on
Great article Ashraf. Interested in how you get this dashboard out of GA like the screen grab
Comment by Ashraf Chohan posted on
Hi Dominic
You can replicate the dashboard by simply creating widgets set to the example shown above. Use 'Active Visitors' as your metric and filter for the specific page or pages you want to feature in the widget. There are a maximum of 12 widgets you can create in a Google Analytics dashboard.
Hope this helps
Ashraf
Comment by Rik Williams posted on
I've done something similar in my university IT department. However I also rotate the dashboard[1] to a live stream of an 'off-topic' web cam[2] to help build and *maintain* interest in, and contact with, the data.
There is a danger that plasma TVs broadcasting 'live IT data' can become ignored soon after their initial creation. Perhaps this is banner blindness, or an assumption that the data, whilst live, never appears to change (...unless you spend time and go deeper).
I'd be interested in hearing about other peoples implementations and any effect it may have had on production systems, or upon organisational culture.
[1] https://addons.mozilla.org/en-us/firefox/addon/tab-rotator/
[2] https://new.livestream.com/FosterKittenCam (left field, but effective; YMMV!)
Comment by Stuart Barker posted on
I like this review of real time data. What tools are there out there that an average business could use to get the same results or this all built in house?Are there more examples of how this data has driven a change for the better for the end customer?
Comment by Ashraf Chohan posted on
Hi Stuart
Thanks for your comment. Most of the popular analytics vendors, including Google Analytics and WebTrends have 'real-time' data features. The real-time internal search terms screen was created by a developer using an API. For the dashboards we just manipulated the real-time features that were available to us in our analytics UI.
We're still experimenting with real-time data and using it more on services we are building. It's helping us see the volumes of traffic coming in at different times of the day and to identify the stages where users are potentially struggling so we can do more testing.
Comment by Joshua Mouldey posted on
Hi Ashraf
Thanks for the information in the post - I've copied the idea of the topics dashboard for our (local authority) website, which works really well.
Is the code for the real-time internal search terms screen available on the GDS github at all?
Comment by Ashraf Chohan posted on
Hi Joshua
The code is publicly available here: https://github.com/edds/display-screen, we'll be interested in seeing how you apply it for your own organisation.