The performance team is giving service managers the ability to customise the timeframes on dashboards.
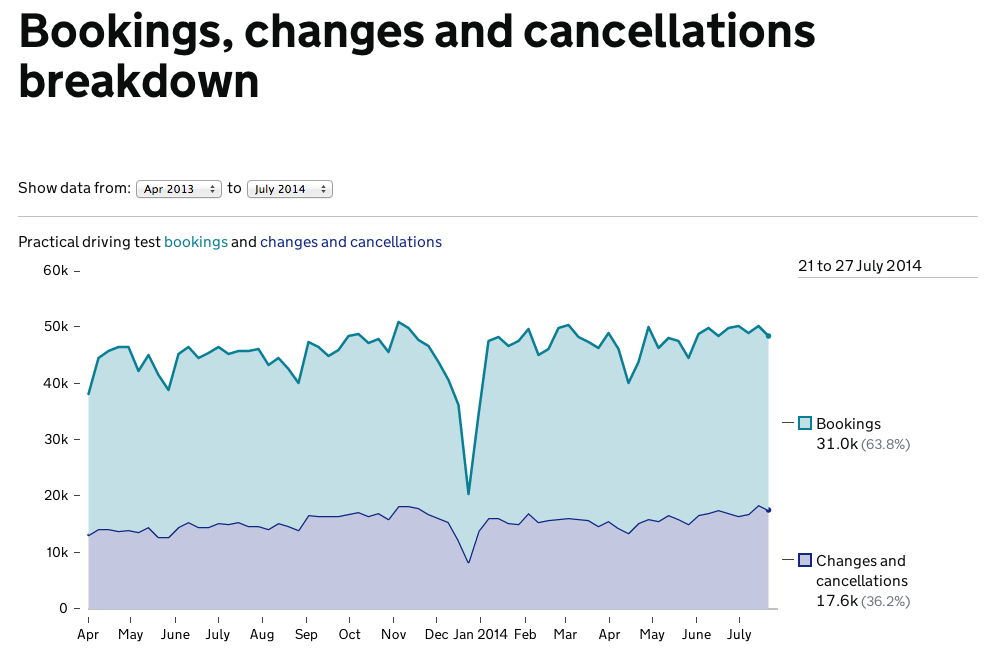
When viewing statistics about their service, service managers can now select a start and end month on the dashboard graph. This will let them easily compare seasonal trends, or make presentations about specific time periods.
We’ve made a couple of other updates to the data and labelling we display.
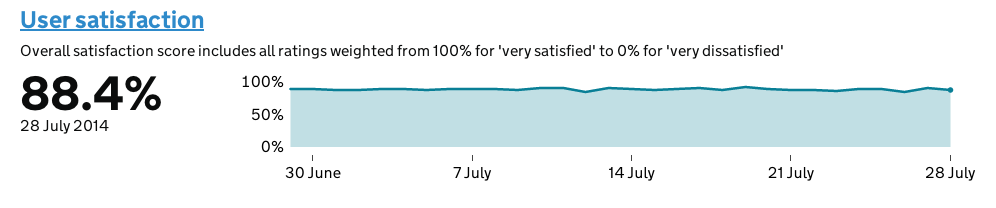
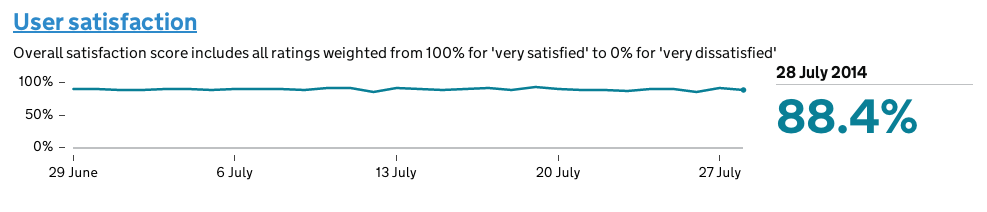
Our labeling is now consistent on all dashboards, making it easier for you to quickly scan them for key facts. For example, all summary figures are now displayed on the right hand side.
You’ll also notice we now show the latest value about your service rather than the average. This is because our performance dashboards are focused on real time information and it therefore seemed strange not to have the latest figure available at a glance.
There is a lot more work to do on all of this and we are keen to get feedback on how it works and what would make it better. So please do get in touch performance@digital.cabinet-office.gov.uk or leave a comment.