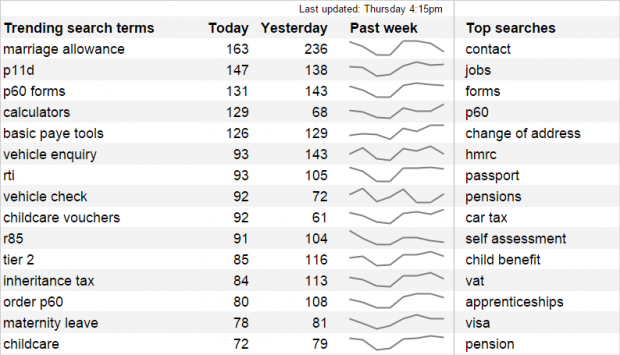
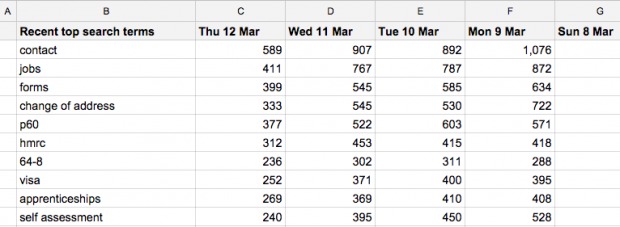
Using Google Analytics and Google Sheets, you can set up a dashboard to see search terms that people are looking for more than usual. By filtering out searches that are popular all the time, you can focus on what’s new or noteworthy.
We use this to keep an eye on topical and seasonal user needs on GOV.UK, so that we can react quickly to rising searches and make sure people can find relevant information.
I’ll show you how I made this dashboard, step by step, so that you can build your own version or adapt it to your needs.

Here’s one I made earlier
To save time, open this ready-made trending searches spreadsheet and go to File > Make a copy… to save an editable version. Then you can change the Google Analytics view ID and customise the configuration.
I’m looking at internal site search terms here, but you could use the same method for external search engine keywords that brought people to the site (taking into account that up to 90 per cent of keywords are ‘not provided’), or for trending content pageviews.
Install the Google Analytics add-on
If you don’t already have the Google Analytics spreadsheet add-on installed, go to Add-ons > Get add-ons… to add it to your spreadsheet.
Set up daily search reports
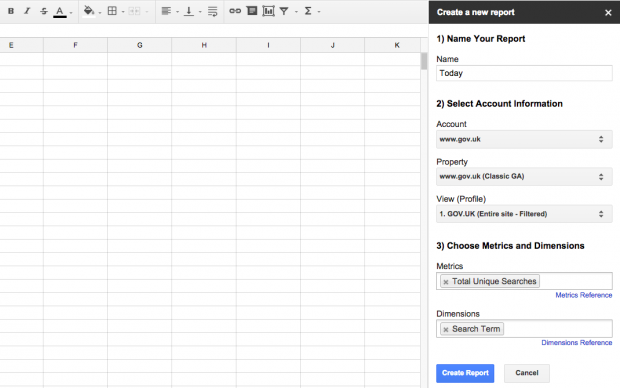
If you’re starting from scratch, create a new spreadsheet in Google Sheets, then go to Add-ons > Google Analytics > Create new report. In the ‘Create a new report’ sidebar, name your first report ‘Today’, and set your Google Analytics account and view (profile). Select the Total Unique Searches metric and the Search Term dimension.

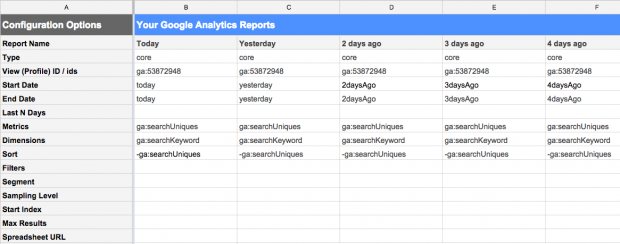
Click ‘Create Report’ and the Report Configuration tab will appear, with those details filled in. Set the Start Date and End Date to ‘today’ and remove ‘7’ from the Last N Days row. Set the Sort option to ‘-ga:searchUniques’ to sort by the number of searches (descending), rather than alphabetically by search term. You can also add filters or segments if you want.
To test your first report, go to Add-ons > Google Analytics > Run reports. If it’s successful, a tab called Today will appear, with today’s top 1,000 search terms so far. (You can change this number with the Max Results configuration option.)
If your site doesn’t get many searches, you might prefer to ignore today and start with yesterday for a full day’s data, or compare weeks instead of days.
Now you can add more reports, for each day of the past week, and for the previous month as a comparison. Copy the ‘Today’ settings from column B into columns C to L, but set the start and end dates to ‘yesterday’, ‘2daysAgo’, ‘3daysAgo’ and so on up to ‘8daysAgo’, and give each column a corresponding Report Name.
In columns K and L I’ve used ‘28daysAgo’ and ‘56daysAgo’, so that we can compare the current searches with what was happening 4 weeks and 8 weeks ago. You can customise these to whatever works best for your content, or leave them out completely.
Once you’ve set up all the columns, run the reports from the Add-ons menu.

Combine the daily data
The next step is to merge data from all these reports into one sheet, on a new tab (which I’ve called ‘Combined’). Leave column A empty, as we’ll be using it later on.
Column B collates the search terms from today and yesterday. They’re case sensitive by default in Google Analytics, so we’ll make them all lower case and remove any duplicates, using this formula in cell B2:
=UNIQUE(ARRAYFORMULA(LOWER({Today!A16:A;Yesterday!A16:A})))
Then look up the number of searches made each day for each of those search terms. Starting with today’s searches in cell C2:
=ARRAYFORMULA(SUMIF(Today!$A$16:$A, $B2:$B, Today!$B$16:$B))
For each row, this formula looks through column A of the ‘Today’ report, finds the search term from column B of the ‘Combined’ tab, and returns the number of searches from column B of the ‘Today’ report. It adds together any variations with different capitalisation (for example, ‘contact’, ‘Contact’ and ‘CONTACT’).
Make a column for each of the reports you created earlier. So in cell D2, put the same formula with ‘Yesterday’ instead of ‘Today’, and so on from E2 onwards. You’ll need to put single quotes around any report names containing spaces, for example: '2 days ago'!$A$16:$A.
Put corresponding column headers in the top row: either 'Today' and so on, or you can show the actual report dates using ‘=Today!$B2’ in column C, then ‘=Today!$B2-1’ to calculate the day before in column D, and so on (and then customise how the dates are displayed at Format > Number).

Optional extra step
For more accurate results you could calculate the percentage share of searches, by dividing the number of searches for each term by the total searches that day (taken from cell B12 in each daily report), as in the formula below. This evens out any big changes in traffic on different days of the week. I’ve left out this step in the example spreadsheet though, to keep things simple.
=ARRAYFORMULA(SUMIF(Today!$A$16:$A, $B2:$B, Today!$B$16:$B)/Today!$B$12)
If you do use the share of searches, you’ll still need two columns with the actual number of searches for today and yesterday as well, to include in the dashboard later.
Filter the trending searches
Now comes the clever part, using the QUERY function to select just the search terms that have increased recently.
On a new tab (which I’ve called ‘Filtered’), in cell B1 we’ll pull in all the rows from the 'Combined' tab where the today column has more searches than yesterday (C > D), or today or yesterday have more than the corresponding day last week (C > J or D > K), or more than 4 or 8 weeks ago (L or M):
=QUERY(Combined!B:M, "Select * where (C > D or C > J or D > K or C > L or D > L or C > M or D > M)", 1)
Then we can sort these results by the number of searches today and then yesterday (‘order by C desc, D desc’), or by both added together (‘order by C+D desc’). And we only need up to 100 results (‘limit 100’), or however many you want to show on your dashboard.
We’ll also set a maximum number of searches for 4 and 8 weeks ago (for example, ‘L <= 100 and M <= 100’), to remove search terms that were already popular. You can find a suitable threshold by trial and error, looking at the number of searches for ever-popular terms that you want to filter out. (If you’ve used the share of searches instead, you’ll need numbers like ‘L <= 0.001’, which means 0.1 per cent of searches.)
Similarly, you could set a minimum number of searches made today (for example, ‘C >= 10’), to leave out insignificant data, particularly when you’re looking at the dashboard early in the day while the numbers are still low.
So the complete formula in cell B1 looks something like this:
=QUERY(Combined!B:M, "Select * where (C > D or C > J or D > K or C > L or D > L or C > M or D > M) and (L <= 100 and M <= 100) order by C desc, D desc limit 100", 1)

Add sparkline charts
Sparklines are miniature charts contained in a single cell. For each search term you can add a timeline showing the daily searches over the past week, to see at a glance whether searches have increased steadily or suddenly, or have already peaked.
This formula takes the values from columns C to J (from today to 8 days ago), but reverses them right to left (‘rtl’) so that the oldest date is on the left of the chart. We can also change the line colour and make the line a bit thicker. Wrapping it with ‘IFERROR’ means that if there’s no data in that row, the sparkline cell will be blank instead of showing an error message.
=IFERROR(SPARKLINE(C2:J2, {"rtl",true; "color","grey"; "linewidth",2}))
You’ll need to copy the formula down to the rest of column A.

If you’d prefer bar charts, set the chart type to ‘column’. You can also highlight the highest value in a different colour or shade using the ‘highcolor’ option.
=IFERROR(SPARKLINE(C2:J2, {"charttype","column"; "rtl",true; "color","darkgrey"; "highcolor","grey"}))

Bear in mind that we’ve only taken the top 1,000 search terms each day, so if some days show no searches it doesn’t necessarily mean zero, it just means the search term wasn’t in the top 1,000 on those days.
Design the dashboard
The finishing touch is to display the filtered results more neatly on another tab, without all the daily figures.
First, use a simple ‘=ARRAYFORMULA(Filtered!B2:D101)’ formula to copy the trending search terms and their number of searches today and yesterday from the previous tab, and then do the same for the sparkline column.
To make the dashboard look nicer, you can increase the font size, turn off the grid (untick View > Gridlines), and shade alternate rows using conditional formatting with a custom formula: ‘=ISODD(ROW())’ or ‘=ISEVEN(ROW())’.

To add the last updated time at the top, you can take the ‘Last Run On’ time from cell B2 in one of the reports, then simplify the date and time format using the TEXT function:
="Last updated: " & TEXT(Today!B2, "dddd H:mmam/pm")

You can also show the overall top searches list alongside the trending searches. Here we’re taking the top 100 search terms from the combined list of today and yesterday, sorted by the number of searches, and removing ‘(other)’ if any data has been rolled up:
=QUERY(Combined!B2:D, "Select B where B != '(other)' order by C+D desc limit 100")
You could publish the dashboard to the web to share it more easily with other people or display it on a screen, but unfortunately the sparklines are blank in the web version.
Schedule regular updates
You can set the analytics reports to run automatically at Add-ons > Google Analytics > Schedule reports. If you’ve included today’s data, you’ll want an hourly running total; otherwise daily reports will be enough.

The first report will run randomly during the time slot you’ve set, and after that the reports will run at the same time every hour or day.
To refresh the data manually, go to Add-ons > Google Analytics > Run reports.
Feedback
If you have any questions or suggestions, or you’d like to share your experiences of customising this dashboard, then please get in touch in the comments section on this page.
7 comments
Comment by Nacho posted on
Hi Tara,
Your post and your spreadsheet is really awesome!! thanks for sharing.
I have a question, can I translate to Spanish and post in a Google's forum? Of Course, I will say that is a translation and the source, url included.
Thanks again
Comment by Jyot Patel posted on
Thanks for sharing.
Really a cool stuff.
Comment by Tom Miles posted on
This is really good stuff thanks for sharing.
I have been trying to do something similar to identify trending searches on our Intranet with some success - I was never convinced I got it quite right. Comparing my attempt with results in your spreadsheet highlighted that I was on the right lines, though your work has helped 'complete the circle'.
Thanks also for the step by step instructions as it helped me tailor my version to expand the samples to weekly - we don't have a large number of searches each day (approx 600-700).
Comment by buzz posted on
Hi,
I created a report as per your instructions but it does not show any data. Looks like
-ga:searchUniques is not working (Not sure though) or is my site not getting enough searches? It shows all data as zero.
My site gets almost 12K+ sessions daily.
Please suggest.
Regards
Comment by Tara Stockford posted on
Hi Buzz
Sorry, I missed your comment. Did you get it working?
Are you getting data on the individual report tabs, before you merge and filter them? You might just need to adjust the filter thresholds in the QUERY formula (for example, ‘L <= 100 and M <= 100’).
Otherwise:
- First of all, can you see site search terms in the Google Analytics web interface? You need to have site search tracking set up in your analytics account (https://support.google.com/analytics/answer/1012264).
- If that works, then try creating a basic site search report with the Google Analytics spreadsheet add-on to check whether you're getting any search data.
- And if that works, then compare the configuration options with your trending searches spreadsheet to see what might be affecting your data.
Hope that helps.
Comment by Joshua Mouldey posted on
Excellent stuff Tara, thanks for sharing. Both for the concept and the step-by-step walkthrough, which is tremendously helpful.
I've set up the equivalent for my own organisation, and it's also given me the headstart motivation/prompt to *finally* get around to producing similar dashboards for pages which are trending.
One amendment I'm making: the query defines trending as any term which is greater than what it was a day ago, or a week ago, or a month ago, or two months ago, etc. However, the dashboard itself only shows today and yesterday. Which leads to some slightly unintuitive results like:
TRENDING SEARCHES
term: 'jobs' searches today: 37 searches yesterday: 38
How is this trending? It's probably because these numbers are higher than they were say a week ago, but that figure from a week ago isn't shown.
So I've split it up into a couple of time periods on my dashboard:
- top 20 results which increased most today compared with yesterday (and the figures for today and yesterday)
- top 20 results which increased most since the same day last week (with figures for today and the same day last week)
- same for today compared with same day last month, etc.
It might be good to compare periods as well as single days (e.g. the number of searches for a term this month compared with last month, rather than today compared to the equivalent single day last month). This would probably result in more subtle changes, but these may be more indicative of longer-term trends.
I've also looked at those trending downwards, i.e. those which have the largest reduction, which is useful if perhaps not as interesting as that which is trending upwards.
The biggest challenge is balancing popular terms/pages against less popular: is it more important to highlight that searches for 'rural tax farm subsidy forms' doubled from 6 to 12, or that searches for 'help to buy' increased by 50% from 800 to 1200? One tells you about a small need on the rise, one tells you about a relatively popular need increasing massively. I see you've gone for a cap to remove popular terms, but I think I'd still like to know about changes with those popular terms, because their impact can be more significant. Maybe need to have two lists - 'increases in popular searches' and 'searches on the rise'?
Comment by Tara Stockford posted on
Thanks Joshua - all good points. For my purposes I've focused on today and yesterday as an early warning sign of anything new or unusual that might need attention to improve our site search results. In this context I don't need to see the popular searches or the older figures; they're just a convenient way of filtering the search terms. But as you say, it's quite easy to add extra columns to suit your needs.
The number of searches today is often lower than yesterday because today is still building up hourly. So small numbers in the early-morning data aren't particularly helpful (you can set a threshold to filter them out), and you might prefer to sort by today plus yesterday ('order by C+D desc'), though that makes 'new entries' today less prominent. You could even just show one column on the dashboard with the combined total of both days.
In my original version of the dashboard, I was actually comparing the current searches with a 4-week period running from 8 weeks ago to 4 weeks ago - that method works better if you're calculating the percentage share of searches (see the optional step under 'Combine the daily data'). To keep it simpler here, I just used the number of searches on single days.
Thanks again for your feedback, and I hope you find the dashboard useful.