The practical issues of working with huge volumes of data are similar for both public and private sectors. These are the security of third party tools, the challenges of visualising data and the frustrations of working at scale.
I joined colleagues from the GDS Performance Analysts team together with analysts from Autotrader and Time Inc to share techniques, tips and the occasional gripe at a mini-summit.

This was the first event, so we mixed presentations and discussion.
We had so much to talk about that presentations were often cut short, combined, or abandoned.
That counts as a major success in this context. The discussions were not an interruption, they were one of the main reasons for the meeting. Instead of there being a painful “any questions” silence at the end of the presentation, we never really got to the end of most slide decks.

The main things I learnt were some very impressive examples of dashboards and of forecasting techniques using R, as well as some extremely practical small tips such as using Google Sheets as an intermediate stage rather than granting a third-party tool full access to a GA account. There were also repeated mentions of problems with the system (notably API sampling, API sampling and API sampling) but without the day turning into a mass whinge session.
On to the sessions themselves…
How to join up your data and do more with it
Kimara Nurse, Autotrader - Big Query and Data Visualisation
Kimara talked about data governance and how Autotrader use visualisation techniques to give their stakeholders access to data in a useful way.
The points which stood out for me were:
- Autotrader use an ETL (Extract, Transform and Load) tool and Big Query to pull data from GA and other sources in order to create a single authoritative source
- the volume of data is a practical problem which turned out to be common to all the organisations at the meeting. At the moment Autotrader are only working in this way with session data. Pageview-level data will be possible when the infrastructure has been scaled to handle it
- Autotrader use Tableau to present the data -- at first they experimented with Google Sheets but moved back from that route
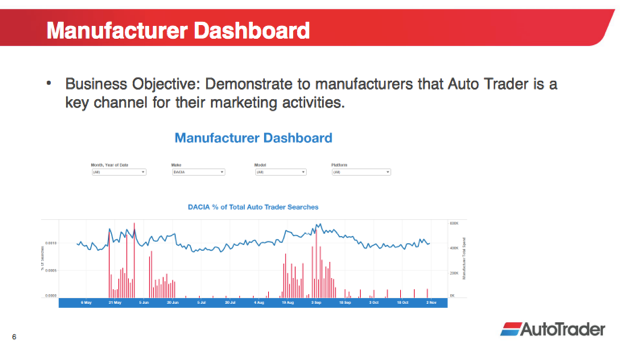
- stakeholders like good-looking visualisations which can be used by teams like the Service Team when working with their clients, such as “Manufacturer Dashboards” which allow car manufacturers to compare trends for individual models
- service team also have a system to identify trade users who are not logging in often which is presented in terms of the next best action to take to get the user active again
This last point triggered an interesting feature request from Time Inc: the ability to identify users who return to the site regularly over a sustained period. It was at moments like that the meeting really took off for me: someone sharing a very specific need which could spark ideas for ways we might all work with the data.
Sampling in the GA data API also cropped up for the first time during this discussion - it’s one of the reasons why Autotrader use ETL/Big Query: connecting Tableau direct to the GA API would introduce sampling.
Some things you should know about GA’s shiny new toys
Robert Wing, Autotrader, Data Driven Attribution - the pitfalls
Robert’s points about GA Premium Data Driven Attribution deserved more time. For commercial organisations, attribution of promotion budget may be a more dominant subject than it is for GDS, but Robert’s approach contained lessons which apply to other aspects of GA reporting.
eg “How long does it take people to convert on average?” It takes more than 90 days for a user to buy a car, so a report look-back window of 30 days is not going to be useful. It's a fundamental question to ask before jumping into reports.
The key point I took home was “ask first, then report” or risk generating misleading reports. This applies to many areas in GA such as custom segments and custom funnels.
Robert ran out of time, so we never got to hear about ‘Econometric Models and Enhancements.'
Use data to look forwards not backwards
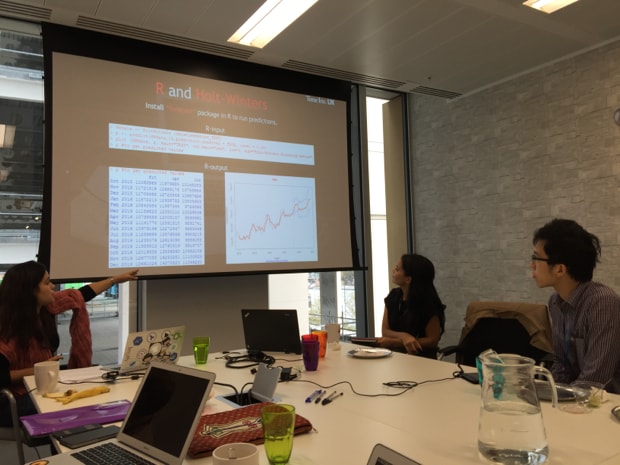
Tatiana Tsaousi, Time Inc, Traffic Forecasts
I was really excited by Tatiana’s presentation. And I was not alone. Half way through one of my colleagues whispered: 'Did you get a picture of that?' The dashboard in question was not a stylish Tableau visualisation, it was hard-core R.
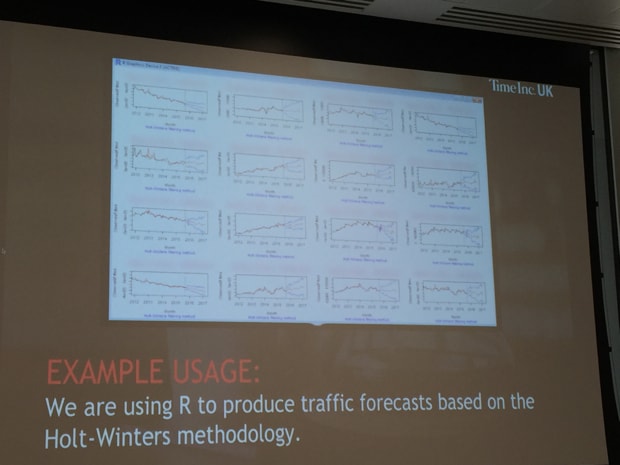
Tatiana’s been working with data which goes back to 2011 and is using the Forecast package with R to forecast traffic. She’s experimented with various methods and has found that Holt-Winters works particularly well for users with Time Inc’s data. It’s not quite so good with pageview data and also doesn’t work well when there are outliers
Tatiana chose Holt-Winters because
- all historical data contributes (Time Inc are using data back to 2011)
- it takes into account seasonality
- it adapts to changes
- it's simple
- it has low data-storage requirements
- it can be automated
This session also span off into a very interesting discussion. Autotrader mentioned that they’d got some very good results using multiple regressions. You could also work with multiple inputs, such as the weather or rate of inflation. On the subject of multiple inputs of that kind, Tatiana commented that IBM’s Watson is very interesting. And on the smaller scale, Rob Wing urged us to have a look at Excel Solver if we have not already done so. We shouldn't overlook the tools we already have.
The R presentation also triggered another discussion about sampling in the GA API. One suggestion was setting up a Custom Table and then pulling the data from that. There was some debate over whether this would work.
Getting the data in front of people in ways that help
Tony Lu, Time Inc, Real Time Dashboards & Automation
Tony Lu specialises in dashboard for Time Inc. They have 17 big TV screens dotted around the building showing dashboards dedicated to specific departments.
The dashboards show what matters to each team: data which they can use to change what they do – push top stories or write more on popular topics. They also introduce an element of gamification with writers competing for top spots
Google Sheets is at heart of the system. They use Sheets to assemble data from multiple sources, clean it up, format and also email out.
Tony has looked at lots of dashboard tools and settled on Klipfolio as the best fit overall for Time even though there are some aspects he dislikes. It pulls data from Google Sheets, instead of using direct API access. This allows granular control of what data Klipfolio sees, instead of “all or nothing”

This presentation prompted a discussion on privacy when using third party systems. GDS doesn't give third party tools because we don't want to grant thirds parties access to all data. One point was that Google Superproxy is a way of making only a very specific form of data available instead of granting full access to GA itself. But that limited set of data is then completely public to anyone who has the URL. Sharing ideas like that are what made the event so interesting.
How to handle large numbers of users
Anne Carr, GDS, Too Many Users - the challenges of managing a large stakeholder base
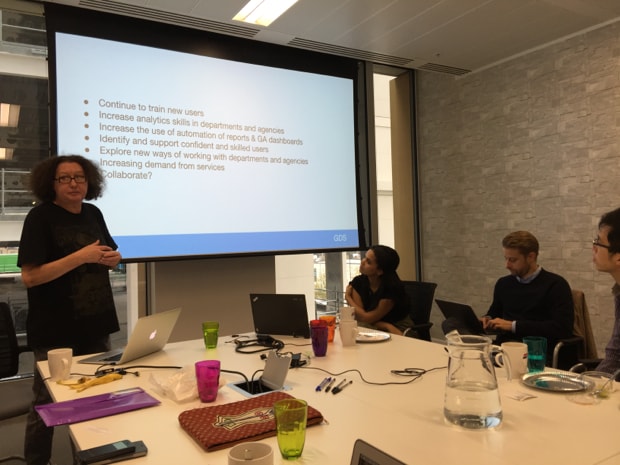
Anne had to rush through her presentation, which was a shame because it contained some laughs alongside some of the serious challenges of working with more than 600 GA users.
The existing interface and API make it very hard to work with so many users.
Google’s “one account, all of Google” system makes it impossible to keep unrecognisable Gmail addresses being used by User Management interface.
Tip: when you need to ask people to re-identify themselves there’s no point in wasting time with an email series, so go straight to the “Act now or your GA access will be deleted” subject line - that message does the trick.
Getting the data out in the open
John Byrne, GDS, “If you could get it with a Freedom of Information request anyway…”
John Byrne’s presentation was also cut short, but he showed examples of the public dashboards GDS use to make data about site performance available. And he also, given the GDS commitment to Open Source, shared the code we use to create them.
Sharing ideas between public and private sectors works
This meeting could have been a quiet one, but it wasn’t. We talked (a lot) and we swapped ideas. The problems of working with huge amounts of data are common to public and private sector and we all share concerns about privacy and security.
We’ll be meeting again and will be sharing more ideas here.
Tim Leighton-Boyce is a senior performance analyst in GDS. Follow him on Twitter: @timlb