GOV.UK can be represented as a multilayer network
GOV.UK is a group of pages that comprises the best place to find government services and information. In its most abstract form, GOV.UK can be represented as a network made of pages, represented as nodes, that are connected to each other using links.
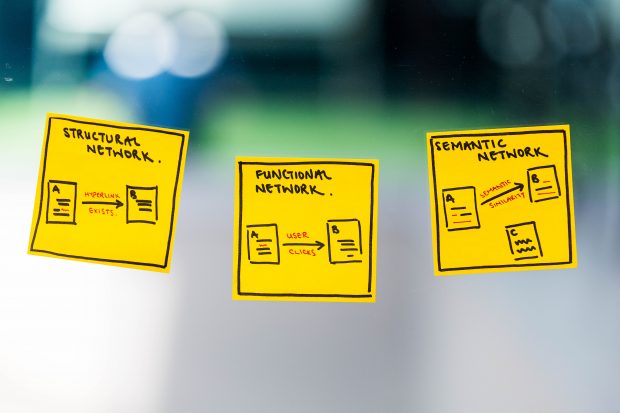
The links indicate a relationship between the pages, and the way we define them can give us different insights about our content.
Currently, we have three ways we can connect pages: via the hardcoded links found in the text, by users clicking from one page to visit another and, finally, by their semantic similarity.
Publishers define the structural network
When publishers create a new piece of content they include links to other related pages. Then certain navigational links that facilitate browsing, like breadcrumbs and other items from the relevant topic in the taxonomy, are automatically linked to the new content item. In this way, the structural network of GOV.UK is created, consisting of approximately 250,000 nodes and 350,000 links.
When we first started using network science methods on the site, our aim was to assess its structural integrity and connectivity. We wanted to know whether all content areas of the site are accessible and linked to – which turns out they are, but a few are more remote than others.
We also wanted to identify the pages that are much more connected than others – what we now call hubs. To investigate these, we calculated network properties, including network density, connectedness, link distribution and centrality measures.
Network analysis has also proven useful in evaluating individual pages. While there are a few ways to describe the format and aboutness of a page, it’s more difficult to determine its position and significance within the overall network. For critical content, we have ranked pages by the number of different functional connections they facilitate, their node neighbourhoods and the subnetworks and communities they belong to.
Users create the functional network
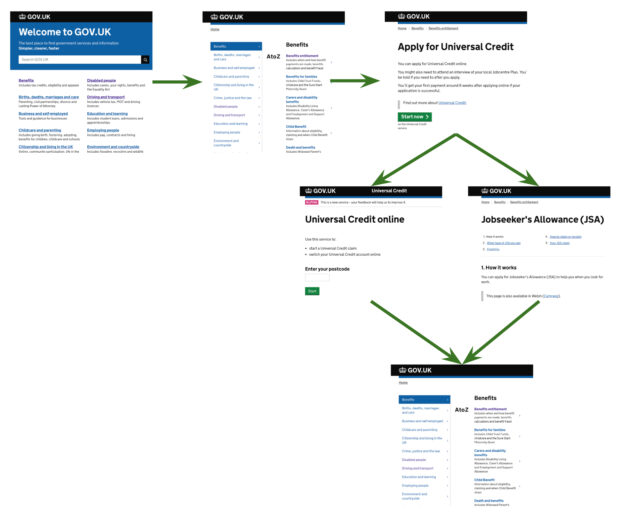
The functional network of GOV.UK is induced by users clicking from one page to visit another, using any of the available links or by using internal search. We create single user journeys by chaining together user page hits within a session and then we accumulate these to create the functional network.
We did a bit of data engineering and created a Python tool (GOV.UK Network Data Pipeline) to automatically extract user journeys from BigQuery – the database that stores our Google Analytics data. These were then aggregated over a specific time period to produce the resulting functional network.
Our main motivation for using this functional network is to learn from how users interact with the site.
Understanding how users navigate the site
One of the things we learned is that despite there being a lot of content on GOV.UK, it turns out users tend to visit a relatively small part of the site. Around 2% of pages are visited at least once in 87% of user journeys.
Also, visits to service pages are very frequent and important. Over a third of journeys contain a service page, and their resulting subnetworks are very densely connected. For example, there are about 250 different links that lead to the ‘Sign in to your Universal Credit account’ page.
And on an average day, between 10 and 15% of the traffic on the site is unique. That means that we have about 1 million unique user journeys, indicating that users go about finding their information in differing ways.
Improving findability using multilayer temporal networks
We wanted to improve the user experience by helping users find the information they seek in fewer steps. So we compared the functional network to the underlying structural network, and used this to inform structural changes that would improve navigation.
For example, where the users were not taking the structural shortest paths, we introduced a step by step process, enforcing a sequence of pages that would be visited in order. And where it wasn’t necessary for users to get information from multiple pages, we added shortcuts to what we thought were their destination pages. Keep your eyes peeled for future blog posts showing how we created these shortcuts and evaluated them using A/B testing.
The authors would like to acknowledge Dr Paul Expert (Imperial College London) for his advice on using network science to improve findability on GOV.UK.
This work will be presented at NetSci 2019, the flagship conference of the Network Science Society, that aims to bring together leading network science researchers and practitioners.
If you want to play with GOV.UK networks yourself, then we have uploaded a copy of the structural network to give you a head start!