The Race Disparity Unit recently published the second in a series of summaries of data from the Ethnicity facts and figures website.
This summary shows key facts and figures about the ethnic diversity of a range of public sector workforces, including teachers, doctors and the armed forces.
It also shows how diverse the leadership is, where data is available, as well as progress towards diversity targets.
While most attention will rightly be paid to the levels and trends in ethnic diversity, the summary also highlighted some data limitations that I would encourage public sector leaders to address.

Use the standardised ethnic categories
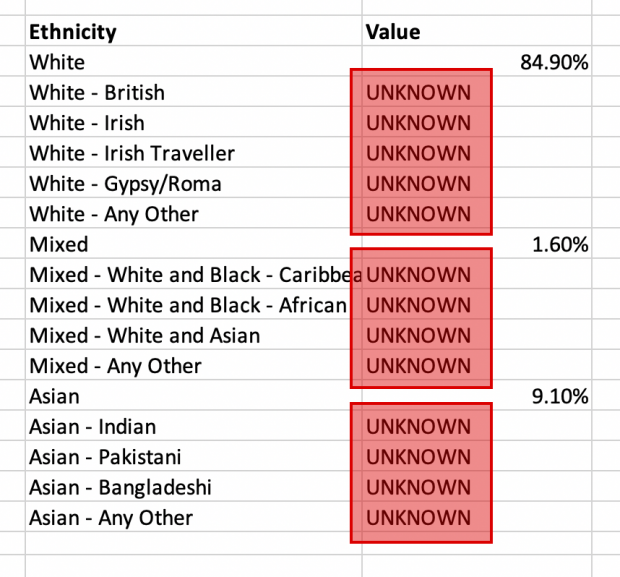
I would encourage the collection of data using the detailed ethnic groups, which follows the approach adopted for the 2011 Census. It is also good practice to publish the data in as much detail as possible (while avoiding the risk of identifying individuals).
In some cases, using the 5 broad ethnic categories (Asian, Black, Mixed, White, Other) might be the most appropriate standard for publication if the numbers are relatively small. In such cases, publishing data for the 18 detailed groups for a particular year might not be robust enough to be useful.
The advantage of collecting more detail is that it enables further analysis, for example by combining data for more than one year.
I'd recommend that those responsible for data about teachers, children’s social workers, police and firefighters should take steps to include the Chinese group in the Asian category, rather than as part of the ‘Other’ category.
The Chinese ethnic group was included as part of the ‘Other’ category in the 2001 Census, but moved to the ‘Asian’ category in the 2011 Census.
Collect data on joiners and leavers
To make data more useful, I encourage workforce teams to publish ethnicity data for people who join and leave the organisation, including those newly promoted to leadership roles. These are helpful when interpreting diversity figures and trends in the wider workforce.
Publish numbers as well as percentages
Publishing numbers of staff in different ethnic groups is an important complement to the publication of percentages. Changes in numbers of staff can sometimes cause unexpected changes in the percentages, so it's useful to be able to see both for the full picture.
For example, in 5 workforces – armed forces, firefighters, prison officers, tribunal judges and non-legal members of tribunals – the percentage of the workforce from ethnic minorities has increased but the numbers of ethnic minority staff have actually gone down slightly (although at a lower rate than for White staff).
Also, in some cases the number of staff in leadership roles is quite small, so the recruitment or loss of a few people from ethnic minorities can have a substantial effect on the overall percentage. Publishing the numbers alongside the percentages can help explain this.
Publish your reporting rates
It goes without saying that we know nothing about the ethnicity of people who don’t provide this information. This makes it very difficult to evaluate trends in ethnic diversity, particularly if reporting rates change substantially over time.
This highlights the importance of publishing reporting rates alongside the data itself, both as a measure of quality and as a way of avoiding misinterpretation. It’s important to attempt to maintain and increase reporting rates to strengthen the quality of the data and to make it easier to interpret and compare with other workforce data.
Use a common publishing format
While the Public Sector Equality Duty requires most public authorities to publish information about their employees, it does not specify in detail what should be published, or in what format. This makes comparisons between authorities difficult.
If you are interested in contributing to our thinking about formats for publishing workforce ethnicity data consistent with the Equality Duty, please leave a comment below.