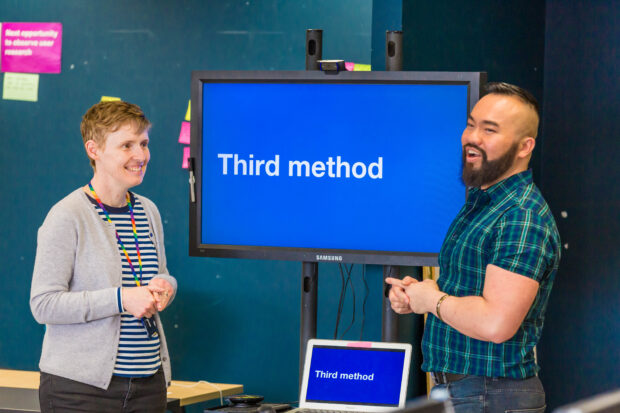
Mixing methods is an approach to research which combines quantitative and qualitative data. Haur and Louise describe how they have used this approach working in the EU Exit Citizen Readiness team at GOV.UK.
As a performance analyst, I (Haur) predominantly work with quantitative data. My insight comes from things like page views, events, and internal search results. Those user interactions and metrics tell me a story.
Qualitative data describes in words rather than measures in numbers. As a user researcher, I (Louise) interview and observe people in order to better understand how they use the things that we make and why they might have problems.
One type of data enriches the other, and for us, it’s a great way to get a fuller picture of how people experience GOV.UK. And, as we’ve said before, better data means better decisions!
As a result of our current focus, preparing GOV.UK for exiting the European Union (EU) on GOV.UK, an opportunity arose to use mixed methods to test whether the prototype ‘Travel to the EU’ journey was easier to use than the live journey
The live version had a journey of 4 pages before users get to the content page from a campaign page. The prototype journey comprised of 3 pages with revised signposting.
The performance analyst’s perspective
In order to collaborate effectively, we identified the most compatible data sources to combine.
We began by exploring the range of information sources available on Google Analytics. The ‘User Explorer’ feature provided the most relevant data for this project, offering a wealth of user journeys.
This provided us with an opportunity to cross-reference data and validate theories about patterns of user behaviour.
We then created a segment to capture certain user groups. In this case, it was users that had seen the ‘landing page’ and ‘going and being abroad page’.
We felt that a week was a good length of time over which we could collect data. We scheduled it to coincide with user testing. This provided a data selection of 100 segmented users to analyse. Eight common user interactions were chosen as a focus of the research. For each of the selected user behaviours, a detailed journey was plotted for each.
This data was then used to compare and contrast with the data gathered by Louise.
The user researcher’s perspective
Our team used analytics and previous research to work out what the problems were with the current journey.
We developed a prototype, a shorter user journey, that we hypothesised would solve these problems. I planned the research with the performance analyst so that both the qualitative and quantitative data would help us understand whether or not we’d solved those problems.
We identified the core users for our prototype by looking at things people were trying to do with the existing content through Analytics. So when it came to recruiting participants, I knew we needed to find people who were going on holiday to the EU in the next 12 months.
We wanted to know whether we were improving the experience for users. I planned the approach to lab testing with the performance analyst so that what we saw in the lab could be cross-referenced with data from live journeys.
We created tasks for the lab based on the things people were trying to do with the existing content.
In the lab we observed participants completing the tasks on both live journey and the prototype. The live journey included a long list of content related to going abroad. Participants found it difficult to decide which item on the list was relevant to travelling to the EU, they missed important information because there was too much noise. The prototype journey replaced the list with a single page of content that explained what might change. Participants were able to work out what they might need to do and didn’t miss information.
After the lab, Haur and I worked with the team to compare the qualitative and quantitative data we’d gathered.
It was clear that the prototype journey served users better. The shorter user journey meant that users managed to find content quicker. There was better grouping of content with clearer signposting and titles. Users could see all the information that they needed on a single page, rather than in several places. This meant they were less likely to miss things and didn’t have to make a decision about something that they didn’t know anything about.
What we discovered
Mixed methods research served us well in a number of ways.
Most importantly, it helped us to improve the experience for users undertaking this particular journey.
Our understanding grew. We found that mixing methods actually mirrored the way individuals naturally collect information— by integrating quantitative and qualitative data. For example, users stories frequently combine quantitative data (pageviews, steps and events) with qualitative data (descriptions and areas of highlights) to provide a more complete story than either method would alone.
It also strengthened the relationship between our disciplines. We’re lucky that user researchers and performance analysts work in close proximity - developing a relationship was useful and certainly sustainable.
We’re looking forward to the next opportunity to collaborate!