This blog builds on the recent Algorithmic Transparency Recording Standard (ATRS) publication for Succession Select - an innovative AI recruitment tool developed by the Government Digital Service for HR professionals to select Senior Civil Servants. This blog delves into the need for the tool with an emphasis on trust and ethical development.
The use of the Algorithmic Transparency Recording Standard (ATRS) became mandatory for central government in 2024. Read about how the GDS Data and AI ethics team have rolled out the mandate across government and how they have updated the ATRS to reflect learnings from this process.
...in the public sector, please join the community on basecamp. You may be added by someone already on basecamp from within your own department or contact performance-analysts@digital.cabinet-office.gov.uk if the department...
...analysts do Digital Performance Analysts work with teams that are building new digital products, such as online applications for social security benefits or a new communication tool for DWP employees....
Mixing methods is an approach to research which combines quantitative and qualitative data. Haur and Louise describe how they have used this approach working in the EU Exit Citizen Readiness team at GOV.UK. As a performance analyst, I (Haur) predominantly …
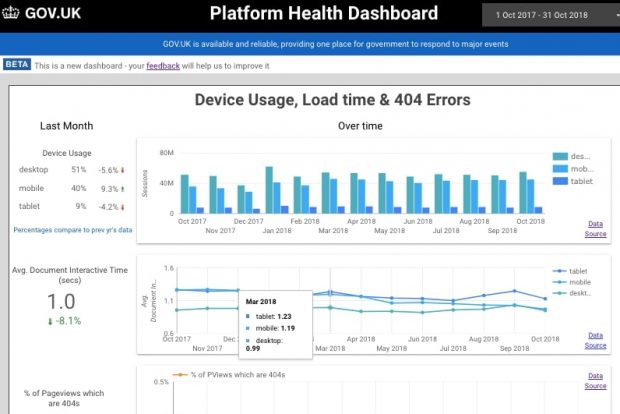
Data democratisation is a hot topic for analysts, so at the Government Digital Service we wanted to share how we’ve approached this by understanding teams’ user needs for data and what we’ve learned whilst working with these data sources.
Four years ago we redefined our role in GDS. Since then we've built an active community of practice across government and worked to build a 'data culture' within product teams. Find out what we've done and our plans for the next year.
Digital analytics and other data sets tell us what is happening, and user research helps us understand why. So, working together, our two disciplines can provide richer insight for our colleagues in multidisciplinary teams. In October, between 70 and 80 …
What is the best way to implement Google Analytics (GA) on Department for Work and Pensions (DWP) services? As DWP digital performance analysts, that is the question we asked ourselves last year, after realising that different services were often tagged …
Related content and links
About this blog
This is a cross government blog about our work with data and the way we’re using performance analysis and data science techniques to improve service delivery and policy outcomes, and our work to find, access and use open government data.