GOV.UK is home to guidance, news and information from all government departments. We have over 400,000 unique pieces of content, and to give our users the best experience, we need to get them to the most useful content as quickly as possible.
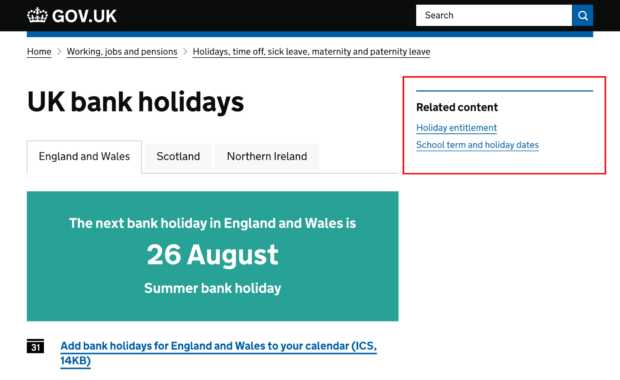
One way of doing this is by adding links to the ‘related content’ section on the right-hand side of each page, so that users can easily navigate to similar pages.
Creating related links
Historically, related links were hand-curated by content publishers with expert domain knowledge. Around 2,000 pages on GOV.UK have these links and to extend this feature to all pages would take a long time. This is where data science can help.
A variety of methods have been documented to have worked well in industry for this task; we needed to test these on our specific use case. We used machine learning algorithms based on our previous work on semantic similarity and network science (log likelihood ratio and Node2Vec) to generate these links automatically.
What would success look like?
We use the scientific method to empirically evaluate any changes we make to the site. We formulate hypotheses and test their falsehood using evidence. We organised workshop sessions with a diverse team of GOV.UK experts to decide on testable hypotheses.

We explored the data available to us to see what we could measure during the test. We presented the options back to our team, explaining how they would be calculated and their feasibility. As a team, we discussed which metrics were expected to change if the newly-generated links were any good. We narrowed it down to a handful of metrics that could be framed as null hypotheses.
A/B testing our hypotheses
Two of the null hypotheses we tested were:
- There is no significant difference in the proportion of journeys using at least one related link. If this is true, then people aren’t clicking our links, probably because they don’t find them useful or interesting.
- There is no significant difference in the proportion of journeys that use internal search. If this is true, then we didn’t provide people with relevant links to click on so they still use internal search to navigate.
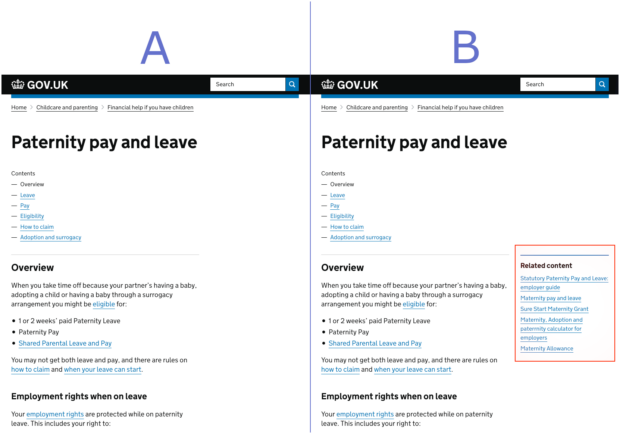
To test these, we ran a randomised experiment and assigned users via a digital coin toss to one of 2 possible versions of the site with equal probability: half the users were directed to the control site (A) and the other half to the site with the algorithmically generated related links (B). This is known as an A/B test and is a popular way of testing changes to digital products.
We wanted to bring our false negative rate down below 20%, so we estimated a good sample size for each experiment; each algorithm’s related links would need to be live for about a week. This meant that we had a very short window between analysing the results, iterating algorithms to make improvements and generating the new and improved related links. So to speed up our approach we wrote code as a software package on Github that enabled us to run the analysis instantly upon experiment completion.
This initial early investment into automation reduced the risk of human error and freed up our time to implement other algorithms. Any of our data scientists could run the analysis and get consistent results to present back to the team, and each experiment was analysed in exactly the same way.
Statistical significance vs practical significance
Excitingly, both of our null hypotheses were shown to be false, meaning that something very interesting was happening on the site.
Our first hypothesis being false implies that users found the related links interesting and/or relevant so they clicked them. For our best-scoring algorithms, users were clicking our related links for over 2.4% of their journeys – that’s improved journeys for more than 10,000 users per day!
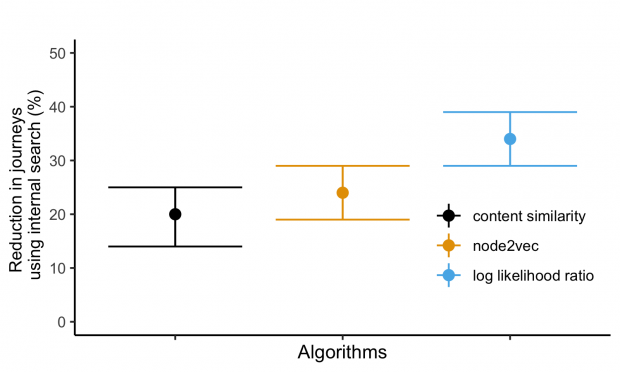
But more interestingly, our second hypothesis being false means that users don’t appear as lost on the site as they don’t use internal search as much. The results show that there’s a potential reduction in internal search by about 20 to 40% depending on the algorithm used.
These scores were not the only considerations for selecting our winning algorithm to deploy – we also considered the economic, social, political and technological ramifications of each approach. Out of the 2 top-scoring algorithms, we decided to implement Node2Vec as it has more potential for improvement.
Moreover, we decided that we would not replace the hand-curated links in those 2,000 pages that had them, as despite how good our algorithms are at the moment, they still do not have the same context as a subject matter expert.
Prior to this work, the vast majority of GOV.UK pages did not have curated recommended links. We automated that process, improving thousands of user journeys per day.
We are very excited to put our algorithmically-generated related links in production within the GOV.UK infrastructure and we’ll tell you how this went soon!