R
The Homelessness and Troubled Families Analysis Team at MHCLG have recently published the latest 2019 Rough Sleeping Snapshot statistics using a Reproducible Analytical Pipeline (RAP). This felt like a real achievement as we are one of the first teams in …
...by mobile phone network across the railways. In conversations with people on different mobile phone networks I had never twigged that the degree of signal loss I experience is not...
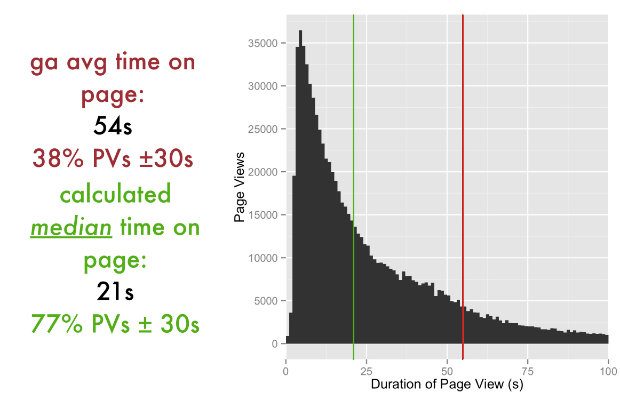
Google Analytics’s Average Time on Page can be a hugely important metric but also a very misleading one. As a mean average, it can be influenced by a skewed distribution, a problem that you can’t diagnose in the web interface. So I found a way to break down the data into individual visit lengths.


