Building a government data community

...forward to announcing the successful candidate soon. Look out for a further blog post from the new community manager when they start to understand their priorities and how to get...

...forward to announcing the successful candidate soon. Look out for a further blog post from the new community manager when they start to understand their priorities and how to get...

...Finalising data sharing agreements to ensure both parties are aligned Facilitating better communication between data acquirers and suppliers Signposting to other data expertise when necessary DNSE handled 30 cases between...

...wanted to be able to find APIs through the hub not just guidance - so easy access to a catalogue of useful APIs is a must We need to redesign...
...arrangements needed to support continuous deployment must come to fruition. It is essential that the team which owns the service is able to deploy code rapidly in response to user...
...to private beta. Reasons The service is meeting user needs has done extensive user testing with real users. The assessment panel were impressed with the frequency of testing and the...
...help with this. SLC should also consider the use of search analytics to help match users' language and help frame potential points where users have questions. 4. Improve User Interface...

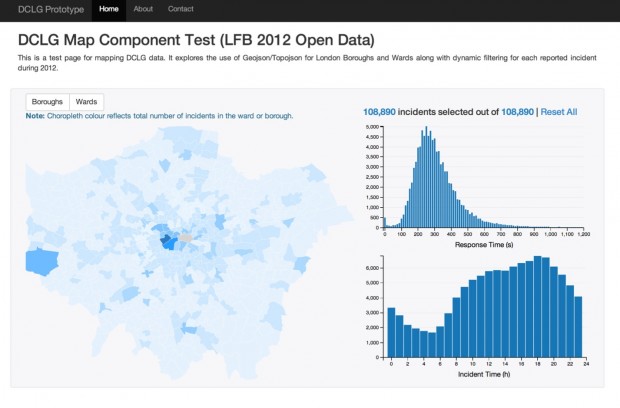
...it’s often useful to look at existing open datasets that achieve balance between data confidentiality and data granularity. The London Fire Brigade (LFB) publish data on data.london.gov.uk, achieving this balance,...
...Assessors Summary: The assessors considered that the service had been built to be consistent with style and content used on GOV.UK. The service is simple and intuitive to use. Results...
...to submit their return. By encouraging customers to use the Checking Service to compile information in the right format from the start, will enable employers to complete the required end...
...guide. The user research shows that the form is simple to use and can be completed unaided first time. Digital by Default Service Standard criteria Criteria Passed Criteria Passed 1...