Improving your average: using R to beef up Average Time on Page
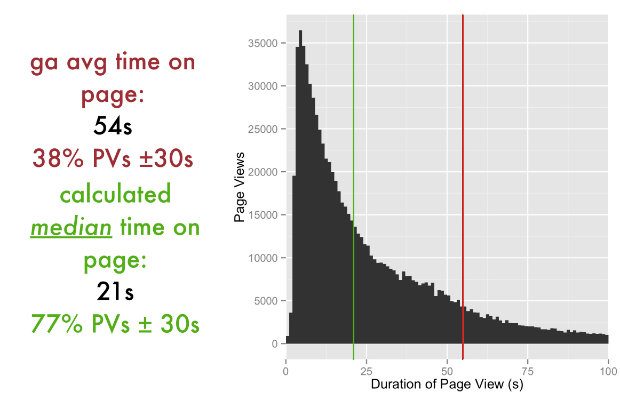
...sessions or pageviews to individual users and give you even better data to play with. Over to you The code I used to perform the analysis is shown below. If...
...sessions or pageviews to individual users and give you even better data to play with. Over to you The code I used to perform the analysis is shown below. If...
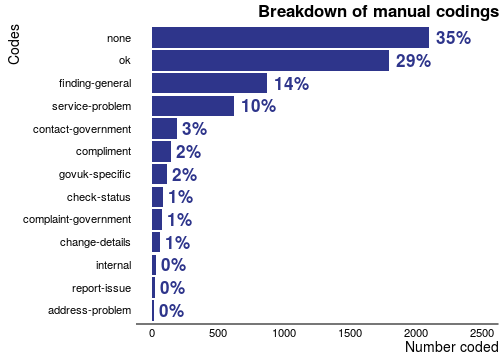
...surprising: 53% of the time, manual coders disagreed about how a survey should be coded. We can see this in the chart below, which shows how often volunteer coders applied...
...the platform may affect many of the central government readers of this blog, team members will soon be posting here about what they’ve discovered and their future plans. Peter Jordan...
I'm posting a link to Tim Leighton-Boyce's recent post on the Inside GOV.UK blog. It's an excellent example of engaging the whole agile team with data, and working closely with...
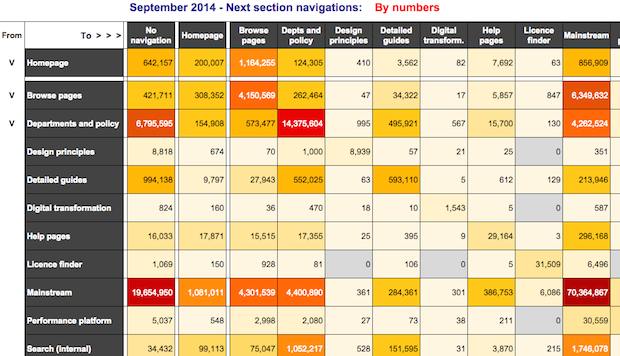
This posts outlines our steps to producing web heatmaps with the help of Google Analytics. It follows my recent post on how heatmaps can show how users navigate around GOV.UK....
...the need to scan documents) and to improve the end-to-end user journey for assisted digital users (by making changes to how delegation to another person is handled). They identified peak...
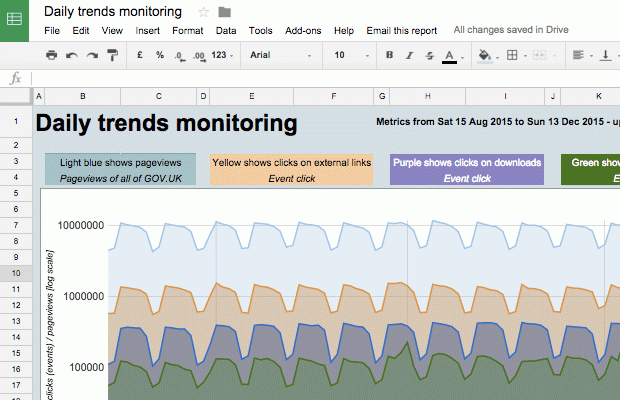
...is one thing. Getting them to regularly review that data is another. So I’ve begun to experiment with emailing the data to them. Google Apps Script is similar to JavaScript...
...evidence was shown of how research has translated into improvements to the service. Progress on content design - the service looks better at each assessment and there is clear evidence...
...and for these to be properly met there needs to be more design input. Security, Privacy, Tools and Standards: The panel would urge the team to look at how they...
...The team were not able to clearly demonstrate benchmarks for success as either completion or satisfaction. The product owner was not empowered to get access to a full team or...

Sign up to get updates direct to your inbox and stay informed about improvements to digital products and services in government.