Annual Tax Summaries - Alpha Assessment
...seeking the information in the Tax Summary but once they see it they enjoy interacting with the information and are interested in how their taxes are spent. The service should:...
...seeking the information in the Tax Summary but once they see it they enjoy interacting with the information and are interested in how their taxes are spent. The service should:...
...started by looking for ways to visualise the data in the Google Analytics interface, as I wanted to be able to break it down into individual visits. This is where...
...from the private beta service in order to more fully understand the primary needs of users affected by PAYE income tax. In particular, the service needs to evolve to a...
...interested in any ways to improve it, so get in touch if you think you’ve spotted a way to make it better. We’re also more than happy to talk colleagues...
...Return isn’t free. We need to do some work to develop it. And there are other risks to consider too. People would need to be able to return to the...
...shape the user needs for the service as a whole. The user research provided some insights into user interface design elements but nothing broader and so is insufficient evidence to...
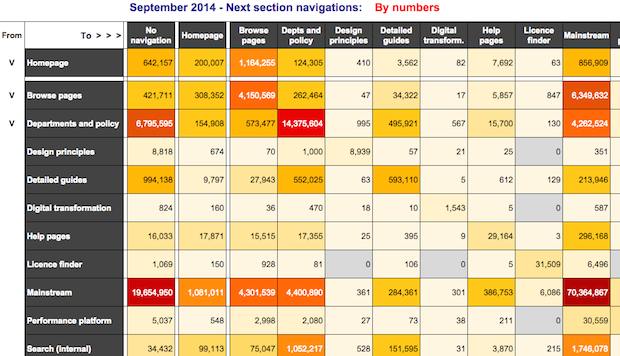
...To obtain a more comprehensive picture of navigations I wanted to include exit behaviour, which I decided to break down into 2 types. The first was ‘bounce’ exits, in which...
...the need to scan documents) and to improve the end-to-end user journey for assisted digital users (by making changes to how delegation to another person is handled). They identified peak...

...model. The model aims to reduce re-offending by enabling Integrated Offender Managers to make early interventions towards identified high-harm offenders. High-harm crimes include modern day slavery, gun and knife crime....
...to do this the first time you run it The script needs to be saved and authorised The code You can paste the code straight into the script editor window....