...it was intended to meet and were planning iteratively to continue your development towards this. Recommendation: consider increasing your user feedback opportunities to align with product releases to gain faster...
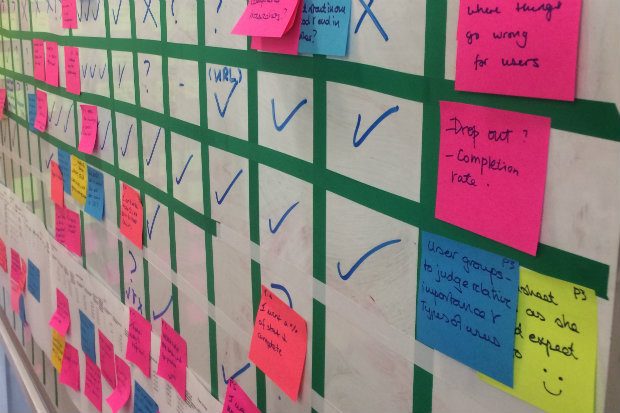
...to better understand how well their content work is performing. The team uses agile methodology to deliver our work, which involves daily stand-ups to provide updates, fortnightly sprint planning, retrospective...
...to resolve this. Multiple items in one cell/column This is also not uncommon. One solution is to use the ‘text to columns’ function to separate text. Multiple formats in one...
...the ATRS, to provide a coherent suite of resources to support responsible innovation we’ve included a self-assessment tool that teams can use alongside the framework to help identify risks and...
The webchat tool will allow users to interact online with a DVLA advisor to assist them in their online transaction or to provide information to answer an enquiry. The tool...
...to departments about their use of spreadsheets and how consistency in extracting information can help improve interoperability. Please get in touch if you would like to share your thoughts! ...
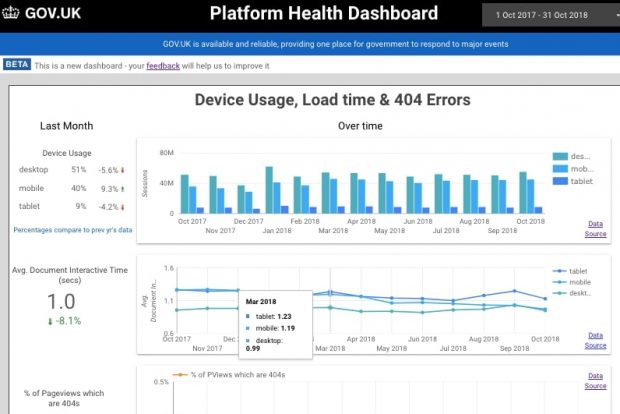
...is not enough To deliver a successful service, a team needs to understand how all the elements involved work together to meet users’ needs. This means including the performance of...
...evidence was shown of how research has translated into improvements to the service. Progress on content design - the service looks better at each assessment and there is clear evidence...
...usability testing should be put in place to continually seek feedback from users. The outcomes of this should feed into the beta development. Roles in the team - Service Standard...
...to inform the future development of the service. It’s not possible for the team to do this until the service goes into production, because the legacy system doesn’t allow for...
Related content and links
About this blog
This is a cross government blog about our work with data and the way we’re using performance analysis and data science techniques to improve service delivery and policy outcomes, and our work to find, access and use open government data.