How to create heatmaps to summarise user navigation
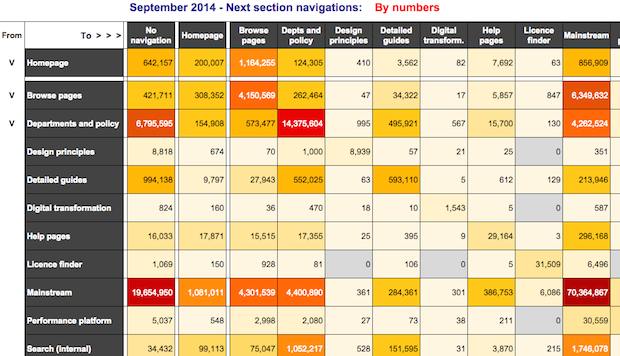
...applied conditional formatting using a colour range from deep red (for the highest end of the scale) to a pale yellow (for the lowest). Zero values were greyed out. Here’s...
...applied conditional formatting using a colour range from deep red (for the highest end of the scale) to a pale yellow (for the lowest). Zero values were greyed out. Here’s...
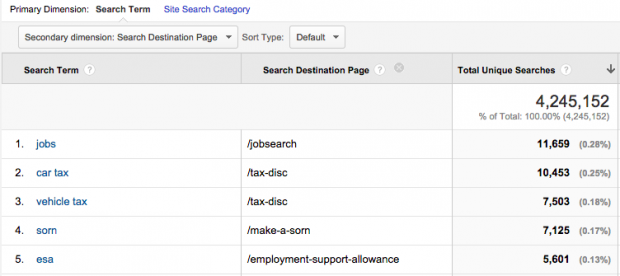
...is still available, but this just gives you the page path for each search query (‘/search’ for GOV.UK searches) rather than the next page after the search results. For years...
...provided access to their analytics for when the service is in public beta. The service mapping work will also enable the team to identify components of the user journey for...
...information for us to understand issues that users are having. This text data is hard to easily understand when viewed across a large number of pages. So for this we...
...be given approval to launch on the service.gov.uk domain as a Beta service. Reasons Although the assessment panel considers that the service isn’t ready for Beta status we’d like to...
...bulk to inform policy and operational planning. He tried out several open-source libraries for reading the XBRL data format, and had most success using the “XBRL” package for R. Work...
...of proposed support in beta. The team has a good strategy for digital take-up next year but will need to think beyond that for the Live assessment. Analysis and benchmarking...
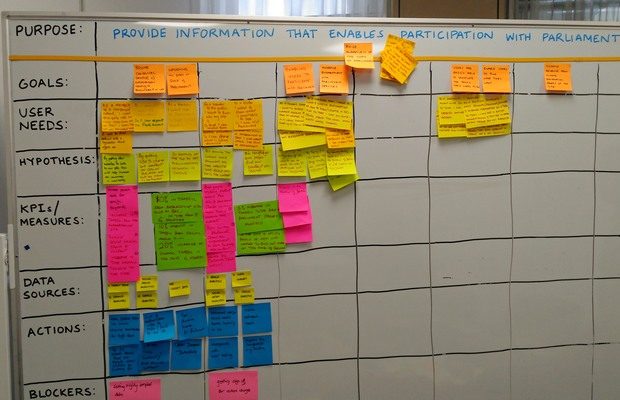
...be used to work these out. Looking at the KPIs and measures the team had established, for the Parliament website, we realised that web analytics would only be useful for...

...on death certificates. As a result, we’re not able to create and update pages for these datasets. The Office for National Statistics (ONS) and Public Health England (PHE) have each...
...to do this the first time you run it The script needs to be saved and authorised The code You can paste the code straight into the script editor window....