...to stay close to. We gained some new customers too, as for the first time there was interest in users’ activity in the run -up to claiming UC. Some active...
...charts and the words we use. While similar to user research, where researchers would talk to people who use the statistics, but it can help to get an “outsider’s” perspective...
...than taking an “Intro to R” course months before they ever get to use it. Paired programming, where two or more analysts code together with one “driving” and the other...
...and be published in the ONS's Faster Indicators Bulletin, now taking approximately two weeks less. This means that data users and policymakers now have access to timely and accurate information...
...services. The team are using tools to check multiple browser compatibility and have access to a library of devices to check how the service works in the real world. Design...
...to this - only adding Help where research had indicated it was useful. The intention is to take it away if stats show few people are using it. The assessment...
...for the DCMS sectors publication. He has made huge strides in making the code easier for statisticians to interact with by translating it into a language they're familiar with. DCMS...
...service, such as the Public Enquiry Line team, and any insights are incorporated back into the service design. Design The team have evidence to show that users are able to...
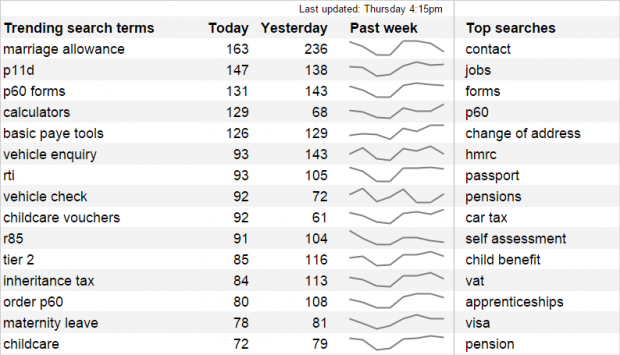
...or you can show the actual report dates using ‘=Today!$B2’ in column C, then ‘=Today!$B2-1’ to calculate the day before in column D, and so on (and then customise how...
...is organised within it. The full taxonomy has been released to publishers to use and at GDS we are putting governance in place to allow for constant improvement and iteration....
Related content and links
About this blog
This is a cross government blog about our work with data and the way we’re using performance analysis and data science techniques to improve service delivery and policy outcomes, and our work to find, access and use open government data.