Join us at DataConnect21 and share your data stories
We are launching a brand new, cross-government data event, running from 27 September to 1 October 2021, and you’re all invited.
We are launching a brand new, cross-government data event, running from 27 September to 1 October 2021, and you’re all invited.

The Data Science Accelerator mentoring programme is expanding to offer a new data visualisation branch. Applications for both open on 14 June.

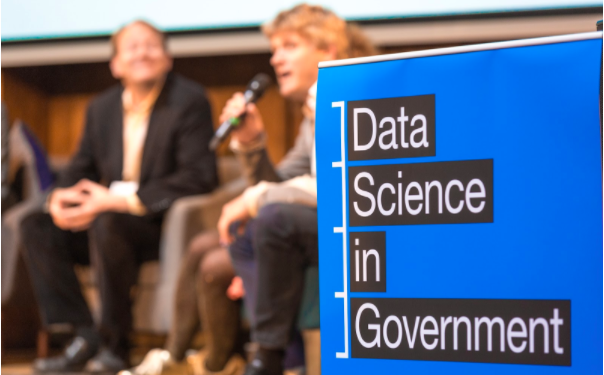
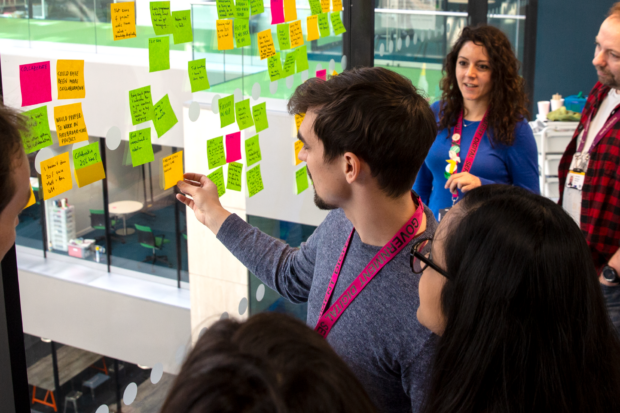
Our diverse range of speakers at the Data Science Community of Interest shared what they think makes a good data science project.
I’ve been passionate about presenting data clearly for over 10 years now, and recently took the lead of a cross-government group of “Presentation Champions”. We share best practice for designing...
...community. I’ve learned how to code in Python and implement various code libraries. I also created a set of tuned machine learning models to classify different crime types based on...
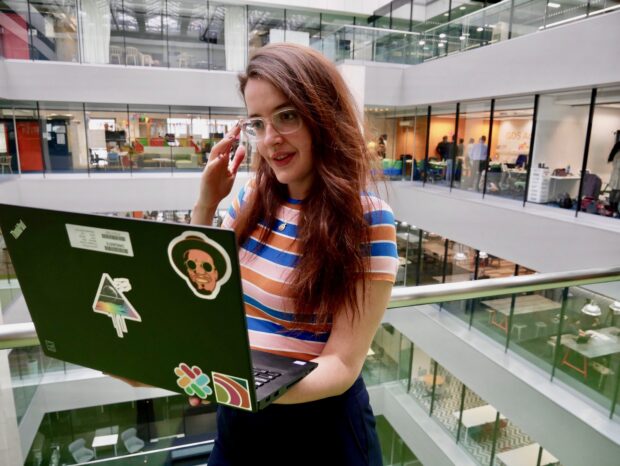
...analysts do Digital Performance Analysts work with teams that are building new digital products, such as online applications for social security benefits or a new communication tool for DWP employees....
...presented a pilot app using machine learning to assist triaging in accident and emergency. Queen’s Hospital sees over 290,000 emergency department admissions per year. The app aims to support NHS...
...the boundaries of their technical knowledge and will have most value to their department and government. Staff have the freedom to choose what they work on and are encouraged to...
...them. For mentors, do not underestimate your own abilities. We are always learning and data science is always evolving. So far, this experience has been incredibly rewarding as I get...
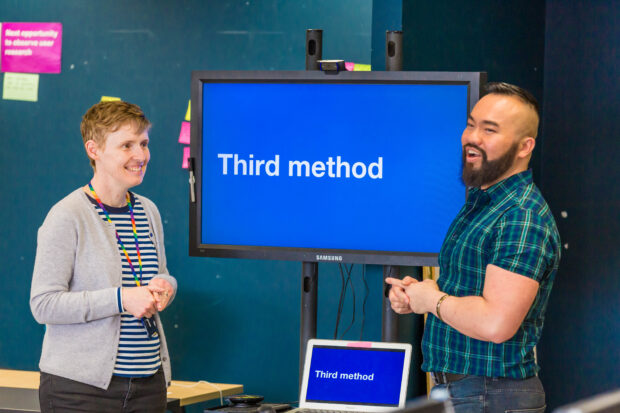
Mixing methods is an approach to research which combines quantitative and qualitative data. Haur and Louise describe how they have used this approach working in the EU Exit Citizen Readiness team at GOV.UK. As a performance analyst, I (Haur) predominantly …