Data insights
...presented a pilot app using machine learning to assist triaging in accident and emergency. Queen’s Hospital sees over 290,000 emergency department admissions per year. The app aims to support NHS...
...inform our practice of combining multiple years’ data to enable us to analyse smaller ethnic groups Get involved Email us or leave a comment below if you are interested in...
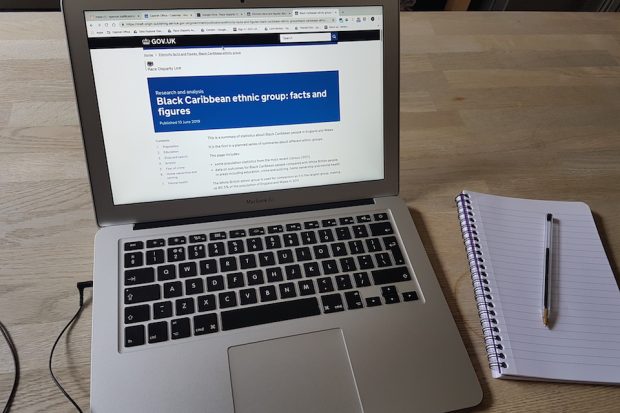
...combining data for more than one year. I'd recommend that those responsible for data about teachers, children’s social workers, police and firefighters should take steps to include the Chinese group...
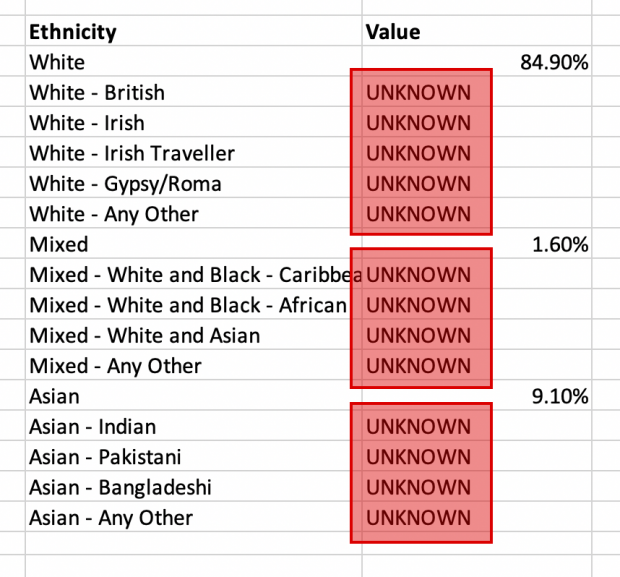
...Mixed, White, Other) or the more detailed categorisation (into 18 ethnic groups), as used in the Census? In making this decision we balanced two considerations. On the one hand, we...
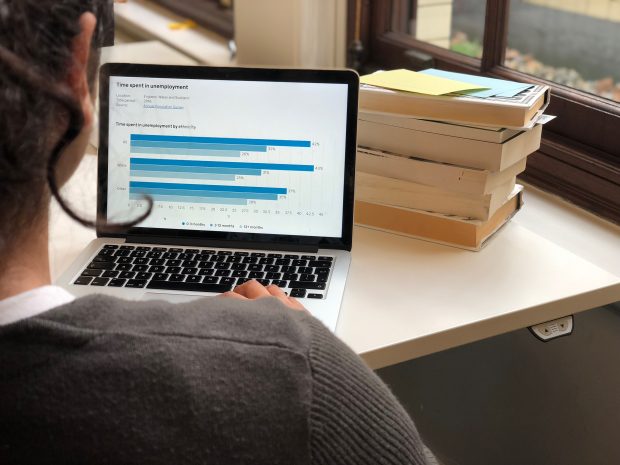
...the employment rate in 2017 for the Indian group was 74%, and for the Pakistani and Bangladeshi group it was 55%. Rule 2: Balance your needs with users’ needs Collect...
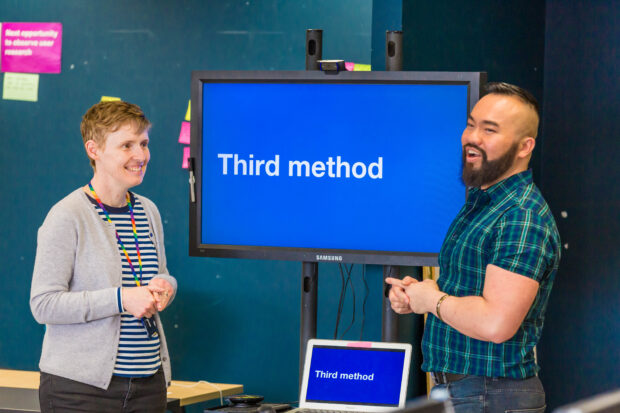
Mixing methods is an approach to research which combines quantitative and qualitative data. Haur and Louise describe how they have used this approach working in the EU Exit Citizen Readiness team at GOV.UK. As a performance analyst, I (Haur) predominantly …
We want to start a data revolution focusing on service delivery and improving human experience. Find out what we think government needs to do and how you can help.
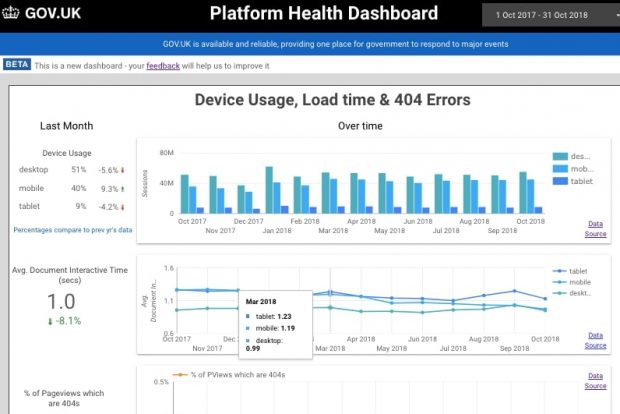
Data democratisation is a hot topic for analysts, so at the Government Digital Service we wanted to share how we’ve approached this by understanding teams’ user needs for data and what we’ve learned whilst working with these data sources.
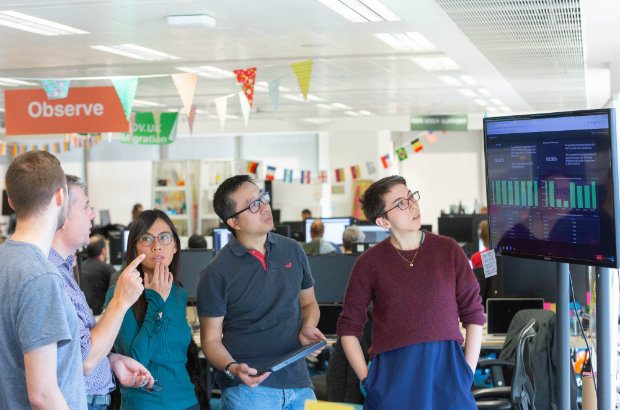
Four years ago we redefined our role in GDS. Since then we've built an active community of practice across government and worked to build a 'data culture' within product teams. Find out what we've done and our plans for the next year.
We're using supervised machine learning to organise all the content on GOV.UK, which means we can do things like create step by step journeys and consider voice activation. Here's what the data science team did.