From fridge yetis to real results: how the HMRC app is helping people take control of their money and tax
From fridge yetis to real results: how the HMRC app is helping people take control of their money and tax
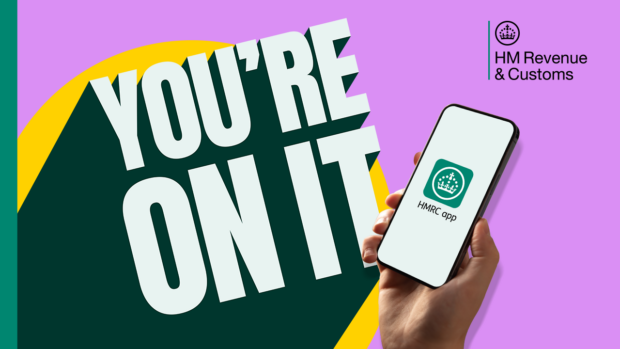
HMRC’s Transformation Roadmap sets out a clear ambition: to make everyday tax interactions simpler and more intuitive to meet customer needs. The increased traffic to the HMRC app this year reflects HMRC’s longer‑term ambition to make it easier for customers …